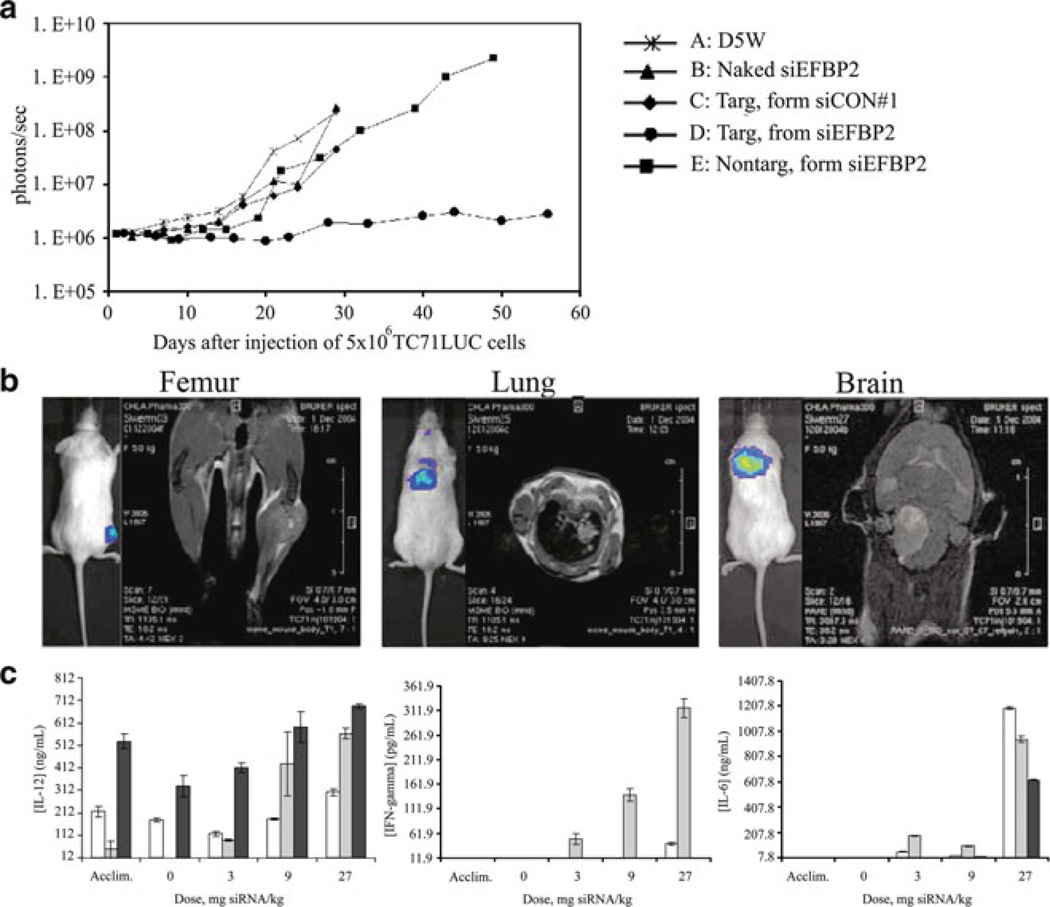
Fig. 23.
In vivo performance of targeted cyclodextrin polycations. (a) Growth curves for engrafted tumors. The median integrated tumor bioluminescent signal (photons/s) for each treatment group (n = 8–10) is plotted vs time after cell injection (days). (b) MRI confirmation of tumor engraftment. (c) Dose-dependent effects on cytokine production in non-human primates. Only very high dosage led to significant increases in cytokines. (ab) reprinted with permission from [174], figures 3 and 5. © 2005 American Association for Cancer Research. (c) reprinted with permission from [177]. © 2007 National Academy of Sciences, U.S.A

