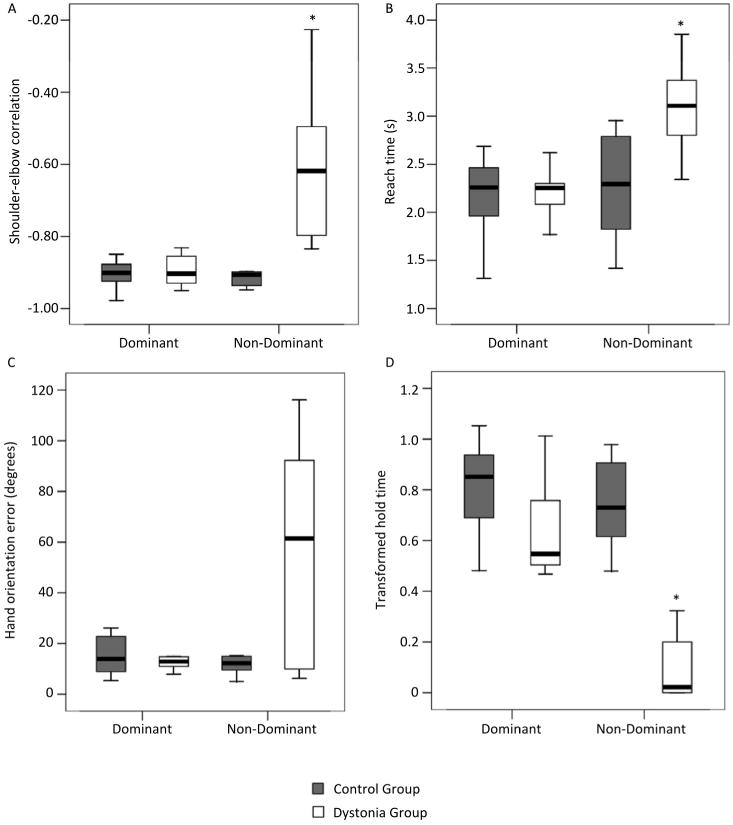
Figure 1.

Box plot showing Shoulder-elbow correlation (A), Reach time (B), Hand orientation error (C) and transformed Hold time (D) of the reach-to lift movements on the dominant and non-dominant side. Values are median (central thick lines), 25% and 75% quartile ranges around the median (box height) and upper and lower limits (whiskers); * indicates significant difference between groups.
