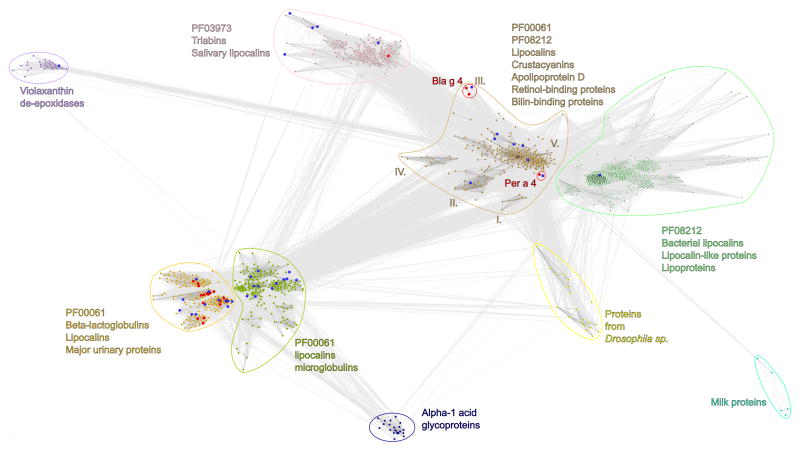
Fig. 1.
Two-dimensional projection of the CLANS clustering results. Proteins are indicated by dots. Lines indicate sequence similarity detectable with BLAST and are colored by a spectrum of gray shades according to the BLAST p value (black: p value < 10−225, light gray: p value < 10−5). Allergen sequences are marked as red dots. Sequences with known structure are marked as blue dots. Allergen sequences with known structure are marked as red dots with blue boarders. Bla g 4 and Per a 4 allergens protein sequences are in the red circles.

