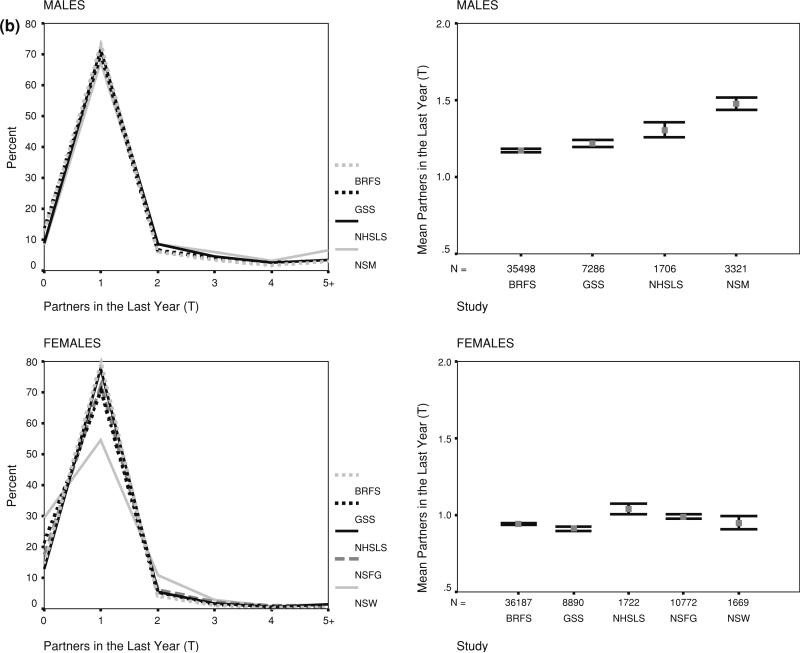
Fig. 1.
Reporting number of partners last year by study, sex and response coding. a (continuous), b (topcoded). Note: Data weighted by original study weights, but not adjusted for differences in sample composition. Frequency distributions are shown on the left, means and nominal confidence intervals on the right


