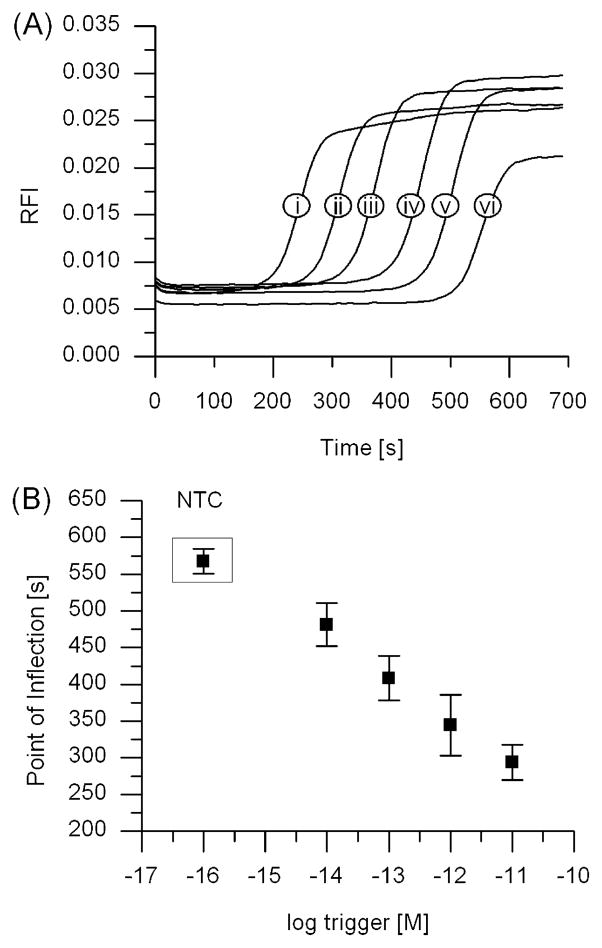
Figure 2.
EXPAR amplification monitored through real-time fluorescence, showing rapid amplification and correlation between the onset of amplification and the starting trigger concentration. (A) Amplification curves using template RAN2 for different starting trigger concentrations of (i) 10 pM, (ii) 1 pM, (iii) 100 fM, (iv) 10 fM, or (v) 1 fM or (vi) in the absence of trigger (no trigger control, or NTC). (B) Linear relationship between the inflection points of the amplification curves shown in panel A and the logarithm of the starting trigger concentration. Averages for the trigger dilution series and the no trigger control represent 10 replicates, taken from five experiments conducted in duplicate on five different days.

