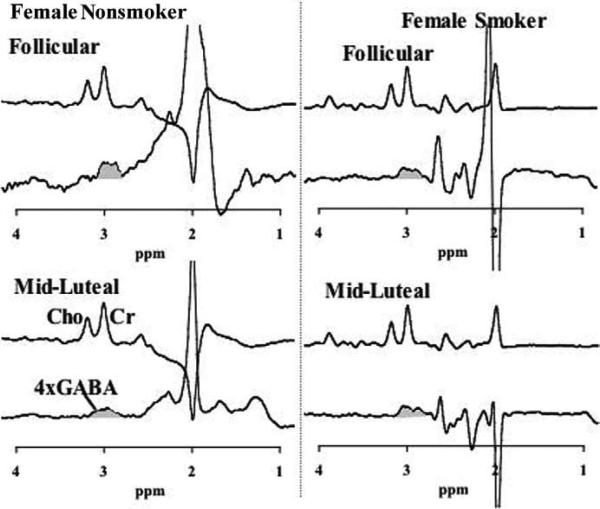
Figure 3.
Representative γ-aminobutyric acid (GABA) spectra in smoking and nonsmoking women. Representative spectra from a nonsmoking woman (left) and a smoking woman (right), for comparison of GABA in the follicular phase (top) and the midluteal phase (bottom). For each phase of the menstrual cycle, a subspectrum from the J-editing sequence is shown so that the creatine (Cr) resonance can be compared with the GABA resonance at 3.0 ppm, which is shaded grey. Cho, choline.

