
Fig. 1.
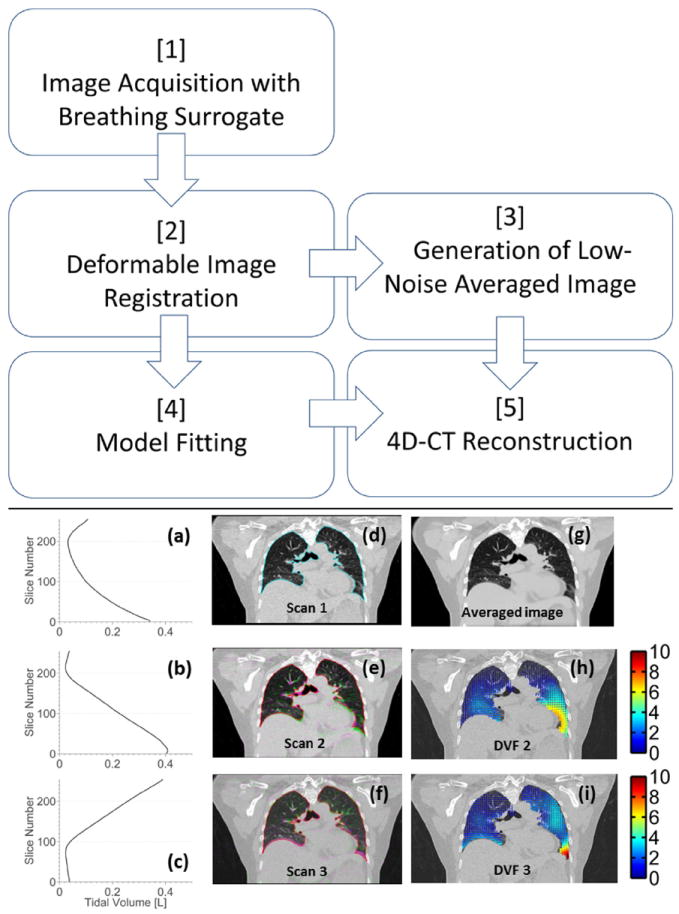
Flow chart describes the technique. (a-c) Tidal volume is plotted against slice number, associated with scans 1-3. (d) Reference scan (scan 1) with lung contour is shown. (e, f) Scans 2 and 3 (pink) are overlaid onto the reference scan (green). (g) Average of 25 images were deformed to the reference image geometry. (h, i) DVF (mm), corresponding to the deformations from each scan to the reference image geometry, are shown. DVF = deformation vector fields. A color version of this figure is available at www.redjournal.org.