
Fig. 3.
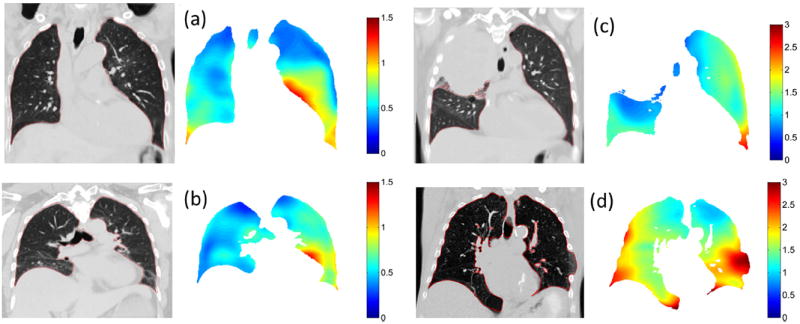
Images at 5th percentile tidal volume and the respective motion model errors (mm) for patients 1 (a), 2 (b), 3 (c), and 5 (d) are shown.
Official websites use .gov
A
.gov website belongs to an official
government organization in the United States.
Secure .gov websites use HTTPS
A lock (
) or https:// means you've safely
connected to the .gov website. Share sensitive
information only on official, secure websites.
Images at 5th percentile tidal volume and the respective motion model errors (mm) for patients 1 (a), 2 (b), 3 (c), and 5 (d) are shown.