
Fig. 5.
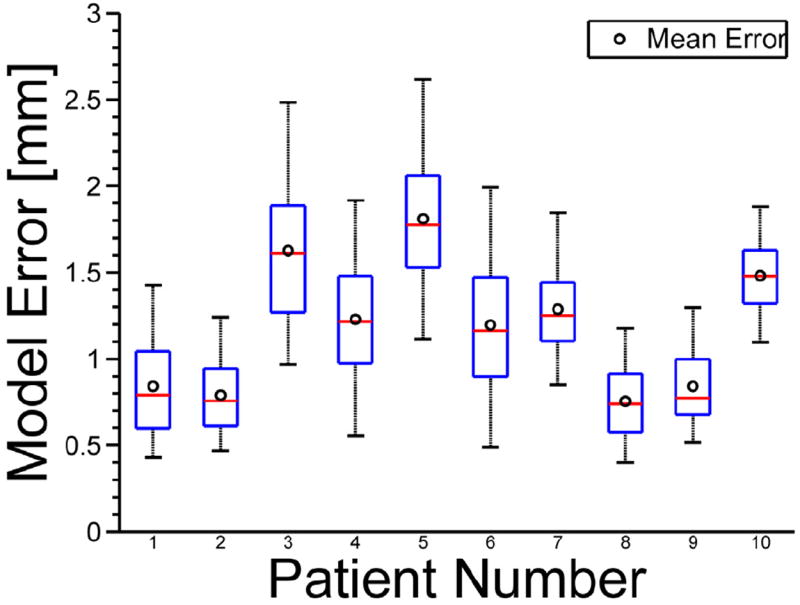
Boxplots show mean (o), median (line), interquartile range (box), and 5th and 95th percentiles (whiskers) of model prediction errors.
Official websites use .gov
A
.gov website belongs to an official
government organization in the United States.
Secure .gov websites use HTTPS
A lock (
) or https:// means you've safely
connected to the .gov website. Share sensitive
information only on official, secure websites.
Boxplots show mean (o), median (line), interquartile range (box), and 5th and 95th percentiles (whiskers) of model prediction errors.