
Figure 2.
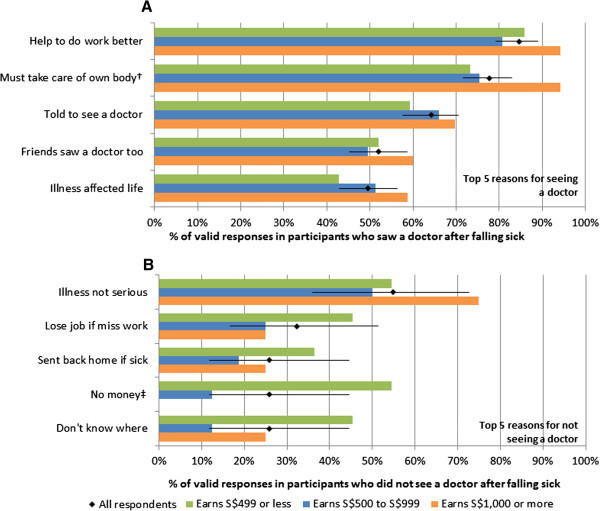
Top 5 reasons for seeing a doctor (A) and for not seeing a doctor (B), with stratification by basic monthly salary. Diamonds give the proportion of all valid responses, with 95% confidence intervals as error bars, while coloured bars give the corresponding proportions for the three income groups: those earning S$499 or less (green), S$500 to S$999 (blue) and $S1,000 or more (orange) per month. Symbols † and ‡ are reasons where the frequency is different between the income groups at p < 0.05 and p < 0.01 respectively by chi-squared test for trend.