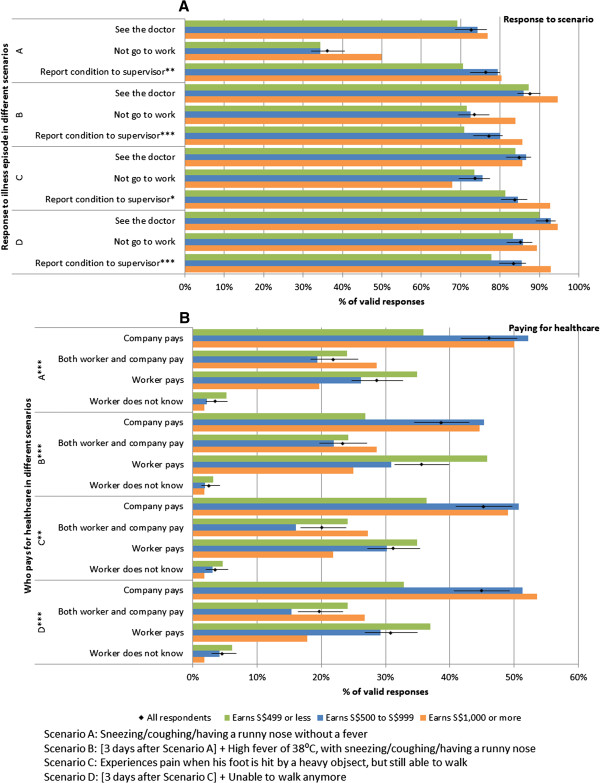
Figure 3.

Responses to illness episode (A) and paying for healthcare (B) in four hypothetical scenarios, with stratification by basic monthly salary. Diamonds give the proportion of all valid responses, with 95% confidence intervals as error bars, while coloured bars give the corresponding proportions for the three income groups: those earning S$499 or less (green), S$500 to S$999 (blue) and $S1,000 or more (orange) per month. Symbols *, ** and *** are differences with p < 0.10, p < 0.05 and p < 0.01 by chi-squared test for trend (A) and chi-squared test (B).
