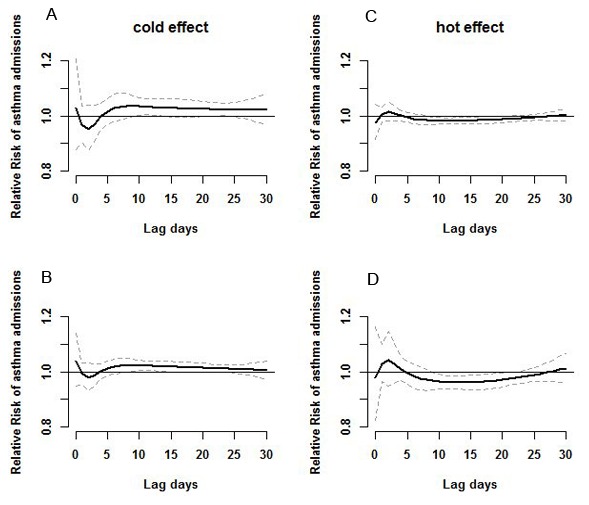
Figure 3. Estimated effects of cold and hot temperatures on hospital admissions for asthma over lag times of 0–30 days.

Panel A shows the effect of 1st percentile (0.2°C) relative to the median temperature(18.7°C); Panel B shows the effect of 25th percentile (9.4°C) relative to the median temperature; Panel C shows the effect of 75th percentile (25.1°C) relative to the median temperature; Panel D shows the effect of 99th percentile (32.7°C) related to median temperature. The centre line in each graph shows the estimated spline curve of relative risk, and the upper and lower line show the 95% CIs.
