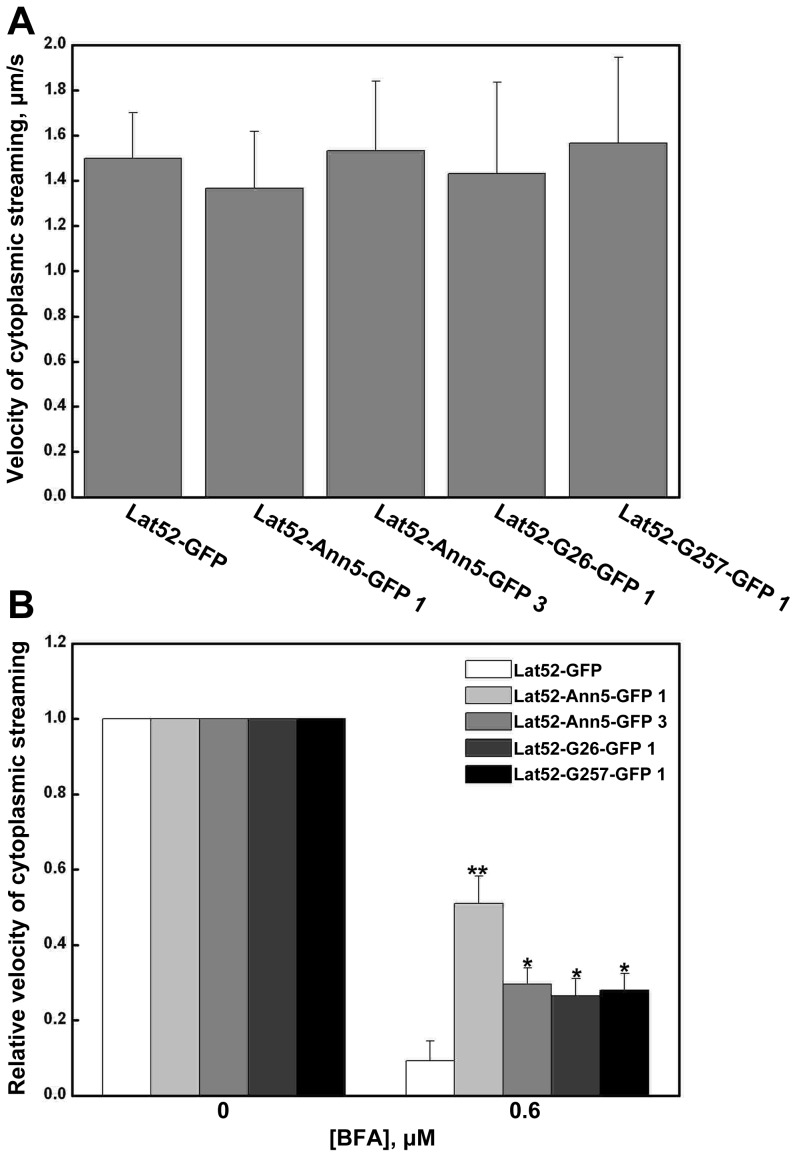
Figure 9. Analysis of the cytoplasmic streaming velocity in pollen tubes of the overexpression lines.
(A) The velocity of cytoplasmic streaming in pollen tubes from the overexpression lines Lat52-GFP, Lat52-Ann5-GFP 1 and 3, Lat52-G26-GFP 1 and Lat52-G257-GFP 1 under normal conditions. Pollen grains were cultured on germination medium for 4 h. Cytosolic particles exhibiting continuous movement were selected at random for velocity analysis using the Image J software. Values represent the means ± SD (n = 25). (B) The relative velocity of cytoplasmic streaming in pollen tubes from the Lat52-GFP, Lat52-Ann5-GFP 1 and 3, Lat52-G26-GFP 1 and Lat52-G257-GFP 1 overexpression lines in response to 0.6 µM BFA. The pollen had germinated normally for 2 h, followed by 2 h in the presence of 0.6 µM BFA. The velocity of the particles of each individual line in normal conditions was normalized to 1. The relative velocity was displayed as the proportion over the control. Values represent the means ± SD. *P<0.05 and **P<0.01 (n = 25) by Student's t test.

