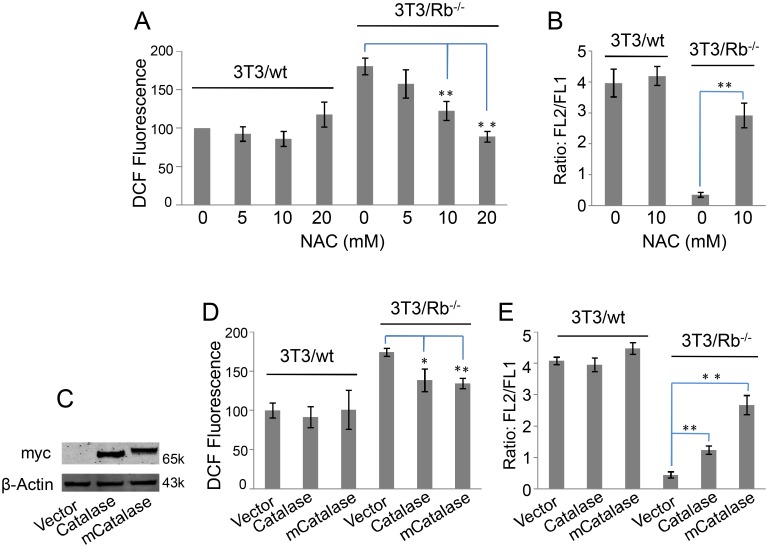
Figure 3. Elevated level of ROS leads to low MMP in 3T3/Rb−/− cells.
(A) ROS levels were determined based on DCF fluorescence after 3T3/wt cells or 3T3/Rb−/− cells were treated with different concentrations of NAC for 24 h. (B) FL2/FL1 ratios were determined based on JC-1 fluorescence after 3T3 cells were cultured for 24 h in the presence or absence of 10 mM of NAC. (C) Over-expression of myc-tagged catalase or mitochondria-targeted catalase (mCatalase) was used to scavenge cytoplasmic or mitochondrial ROS. (D) ROS levels were determined based on DCF fluorescence after 3T3 cells with or without catalase/mCatalase expression were cultured for 24 h. (E) FL2/FL1 ratios were determined based on JC-1 fluorescence after 3T3 cells with or without catalase/mCatalase expression were cultured for 24 h. *P<0.05, **P<0.01.

