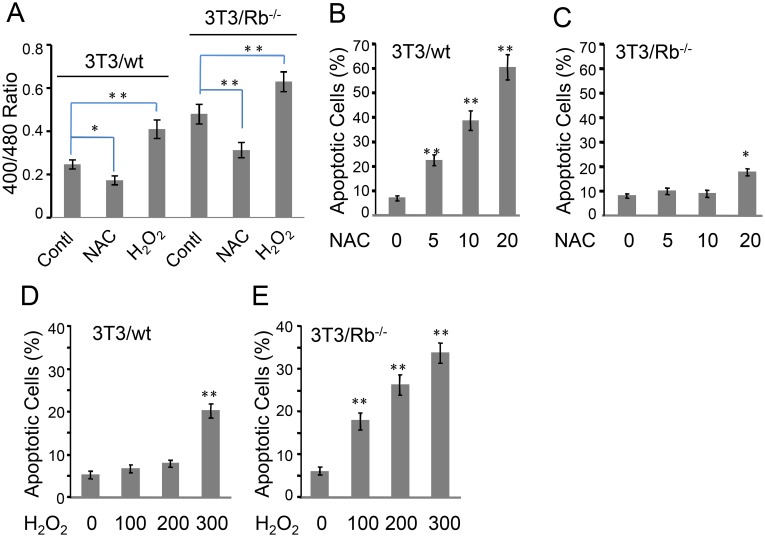
Figure 6. 3T3/wt and 3T3/Rb−/− cells show differential response to redox imbalance-induced apoptosis.
(A) Ratios of fluorescence obtained at 400/480 nm excitation wavelengths in cells expressing Grx1-roGFP2 were measured in the presence or absence of 10 mM of NAC or 200 µM of H2O2 for 24 h. (B and C) Apoptosis was determined after 3T3/wt cells (B) or 3T3/Rb−/− cells (C) were treated with different concentrations of NAC for 48 h. (D and E) Apoptosis was determined after 3T3/wt cells (D) or 3T3/Rb−/− cells (E) were treated with different concentrations of H2O2 for 48 h. *P<0.05, **P<0.01.

