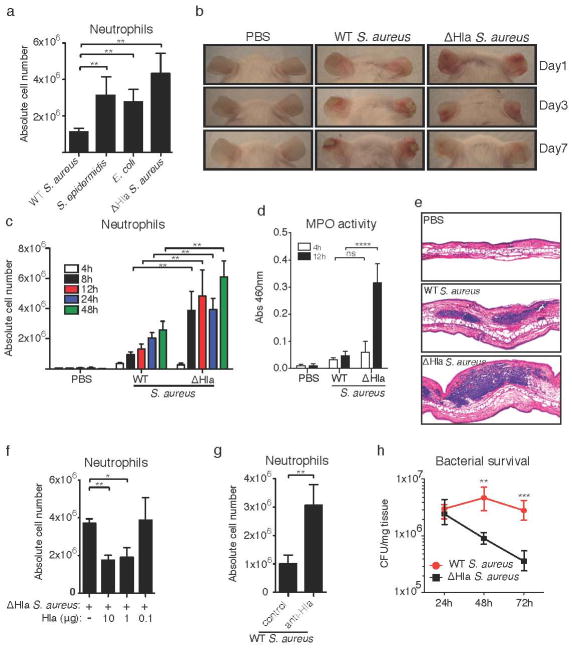
Figure 1. Hla reduces neutrophil influx in S. aureus infected skin resulting in tissue necrosis and increased bacterial survival.
(a) Flow cytometry analysis of neutrophil influx in infected ears with indicated bacteria at 12h p.i. n=4 mice/group. (b) Clinical manifestations, and (c) neutrophil influx of ears infected with WT S. aureus, ΔHla S. aureus or after PBS injection at various timepoints mentioned in the figure. n=3 mice/group for PBS injected at each time point and for all groups at 48 hours; n=4 mice/group for WT & ΔHla S. aureus groups at 4h and 8h p.i.; n=5 mice/group for WT & ΔHla at 12h p.i.; n=6 mice/group WT & ΔHla at 24h p.i. (d) Myeloperoxidase activity in ear skin of mice either sham infected (PBS; n=3 mice/group) or infected with WT or ΔHla S. aureus at 4h (n=5 mice/group) and 12h (n=6 mice/group) p.i. A single outlier sample from the 12hr PBS group was excluded from analysis using the ROUT method. (e) Representative haematoxylin and eosin stained ear sections obtained from mice infected with PBS (n=3 mice/group), WT or ΔHla S. aureus at 6h p.i. (n=6 mice/group). (f) Neutrophil influx in ears of mice at 12h p.i. with concomitant injection of ΔHla S. aureus and purified Hla (n=4 mice/group). (g) Neutrophil influx in ears at 12h p.i. with WT S. aureus in mice pretreated with control serum or anti-Hla serum (n=4 mice/group). (h) Bacterial load (CFUs) of infected ears at indicated time points (n=4 mice/group). Bars represent mean±SD. All data are representative of at least 2 independent experiments except for (e), which is from a single experiment. Statistical analysis was performed on log-transformed data as follows: (a and f) one-way ANOVA with Bonferroni’s multiple comparison test; (c, d and h) two-way ANOVA with Bonferroni test; (g) Student’s two-tailed unpaired t-test was used to determine the P-value. **P<0.01; ***P<0.001; ****P<0.0001; n.s, not significant.

