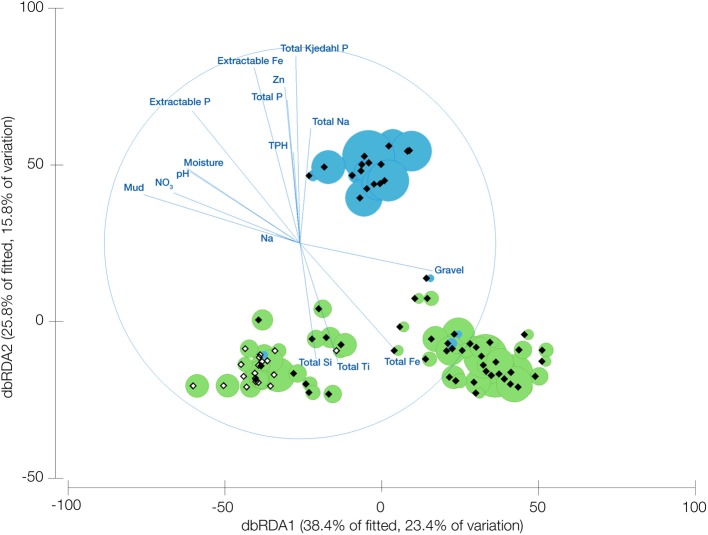
Figure 2.
Distance based redundancy analysis of UniFrac dissimilarity scores for samples where bacteria from the candidate division TM7 are present. Overlayed are vectors representing the correlation of edaphic predictor variables and bubbles representing the relative abundance of the different TM7 classes (TM7-1 green, TM7-3 blue). Open diamonds represent Arctic samples and shaded represent Antarctic samples.

