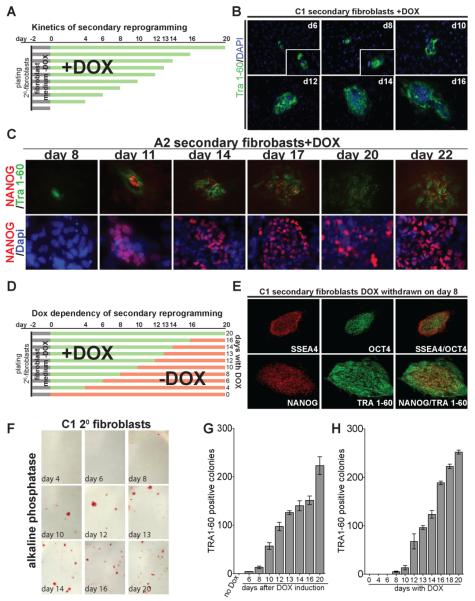
Figure 4. Kinetics and requirement for transgene expression of secondary fibroblast reprogramming.
A. Experimental outline of reprogramming kinetics experiment. Secondary fibroblasts were plated in DOX-free fibroblast medium on day -2 (black bars). After two days (day 0) medium was changed to hES medium containing DOX (green bars). Cells were fixed at the indicated time points and stained for pluripotency markers.
B. Immunostaining of C1 secondary fibroblasts for Tra 1-60 at indicated days after DOX induction. Inset shows magnification of the same picture.
C. Immunostaining of A2 secondary fibroblasts for Tra 1-60 and NANOG at the indicated days after DOX induction (upper panel). Lower panel shows a magnification of NANOG and DAPI staining of the same area.
D. Experimental outline of the DOX withdrawal experiment. Secondary fibroblasts were plated in fibroblast medium without DOX on day -2 (black bars). After two days (day 0) medium was changed to human ES cell medium containing DOX (green bars). Medium was changed to hES medium without DOX at the indicated time points (red bars). Secondary iPS colonies were picked on day 20 for all DOX conditions.
E. Immunostaining of secondary C1 iPS cells for SSEA4, Tra 1-60, OCT4 and NANOG, which were derived by DOX-induction for 8 days.
F. Alkaline phosphatase staining of C1 secondary fibroblasts at day 20 after exposure to DOX. The day indicates the time when DOX was withdrawn from the culture medium.
G. Number of reprogrammed colonies at different times after addition of DOX. The number of colonies on the indicated day was determined by immunostaining for Tra 1-60. Error bars indicate the SEM generated from triplicates of the same experiment.
H. Number of reprogrammed colonies at day 20 after DOX addition. DOX was withdrawn from the culture medium at the indicated time points. The number of colonies was determined by immunostaining for Tra 1-60. Error bars indicate the SEM generated from triplicates of the same experiment.

