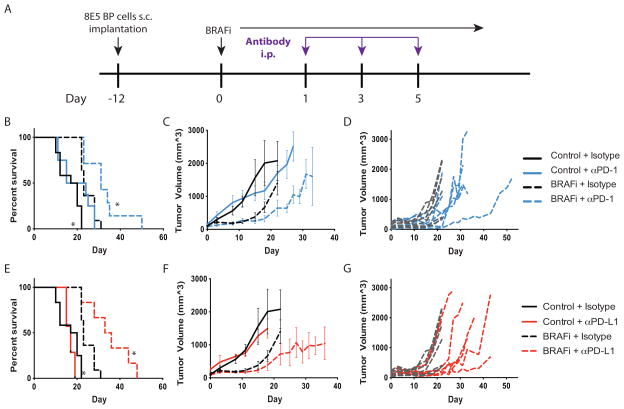
Figure 5. PD-1 or PD-L1 blockade synergizes with BRAF inhibition to slow tumor growth and increase survival.
A, Schema for combination treatment using PD-1/PD-L1 blockade and BRAFi after BP cell implantation. 8×10⁵ BP cells were given to C57BL/6 mice s.c., and BRAFi (200 ppm) was initiated at day 0. 100μg of anti-PD-1 (29F.1A12), 200μg anti-PD-L1 (10F.9G2), or isotype antibody was administered i.p. at days 1, 3, and 5. B–D, Effects of combined BRAFi and anti-PD-1 on the survival and tumor volumes in mice given BP tumor cells. Kaplan-Meier plot showing survival after BRAFi and anti-PD-1 combined treatment averaged for all mice in each treatment group (B). Tumor volumes (measured every 3–4 days) are averaged (C) and shown for individual mice for BRAFi plus isotype control versus BRAFi + anti-PD-1 (D). E–G, Effects of combined BRAFi and anti-PD-L1 on the survival of mice given BP tumor cells. Kaplan-Meier plot showing survival after BRAFi and anti-PD-L1 combined treatment averaged for all mice in each treatment group (E). Tumor volumes (measured every 3–4 days) are averaged (F) and shown for individual mice for BRAFi + isotype control versus BRAFi plus anti-PD-L1 (G). For the Kaplan-Meier plot, control + isotype (n=12), BRAFi + isotype (n=11), control + anti-PD-1 (n=8) or anti-PD-L1 (n=7) or BRAFi + anti-PD-1 (n=7) or anti-PD-L1 (n=6). *, p< 0.05 compared to BRAFi + isotype mice. Tumor volumes are representative of 3 experiments (n>6).

