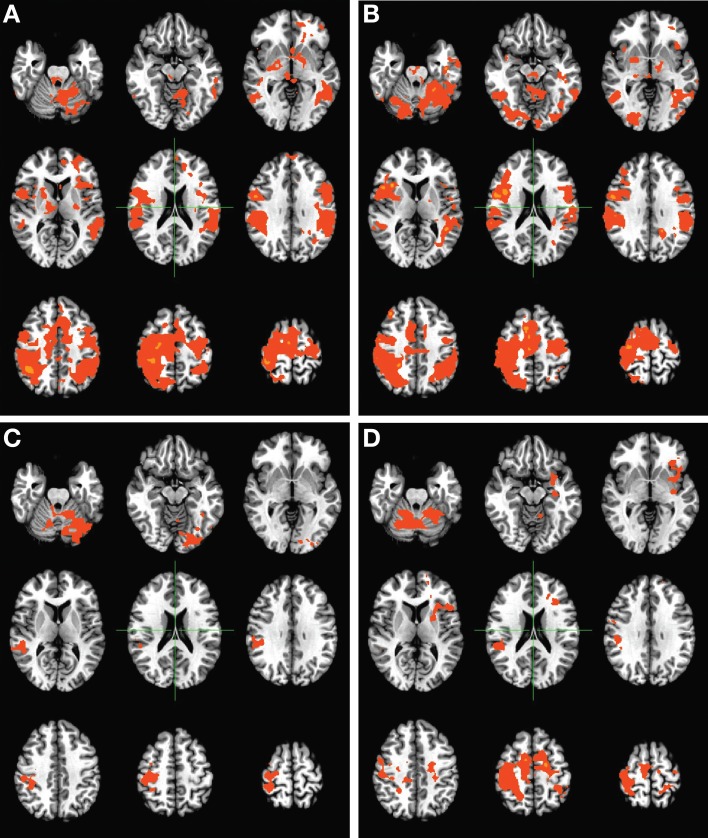
Figure 3.
Group level activation maps for finger tapping of the unimpaired hand during the BCI therapy phase of the experiment. Panels demonstrate activation assessed (A) pre-therapy, (B) mid-therapy, (C) upon completion of therapy, and (D) 1 month after the cessation of all therapy, and show the development of a lateralized, focal pattern of activation with the administration of therapy. Maps are displayed according to radiological conventions, such that the right side of the image corresponds to the left hemisphere of the brain.

