
Figure 4.
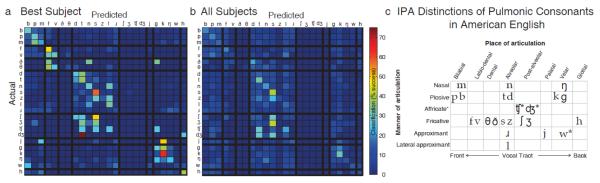
Confusion matrices of decoding results of consonant phonemes for the (a) best performing subject (NU2) and (b) an average across all subjects, with respect to probability of that phoneme occurring within the data set. Phonemes are grouped by place of articulation, one axis of the IPA pulmonic consonants chart [31], with thick black lines dividing each articulation location. Decoding errors most often misclassified phonemes as neighboring phonemes according to IPA designation. (c) A condensed chart of the pulmonic consonants of the International Phonetic Alphabet used in American English. Asterisks denote non-pulmonic consonants.