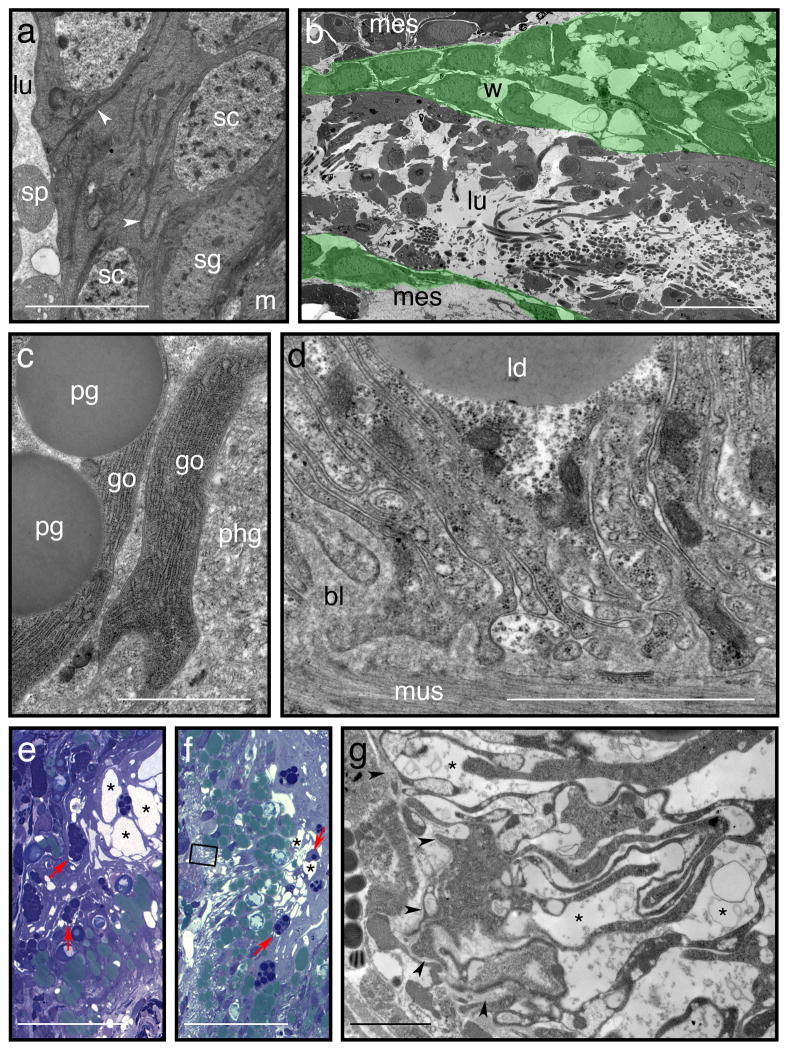
Figure 2. Mildly hypertonic buffers cause pronounced osmotic shrinkage during fixation.
Images are electron micrographs of 70 nm sections, stained with lead citrate51, except for e and f, which are light micrographs of 0.5 μm sections stained with 1% (wt/vol) toluidine blue in 1% (wt/vol) borax. Comparisons between fixation conditions in this figure are based on the experiments described in Figure 1 (between specimens processed in parallel). a: Testis wall from a specimen fixed using EM buffer (54 mM sodium cacodylate). Lumen (lu) with spermatids (sp) on the left, external muscle (m) to lower right. Cells are closely apposed (sc: spermatocytes; sg: spermatogonium) with spermatocytes partly enveloped by thin processes of unidentified somatic cells (white arrowheads). (b) Specimens processed in parallel, but fixed in a primary fixative containing 77.5 mM cacodylate as a buffer, exhibit osmotic shrinkage of cells, disrupting the normal close associations between them. This is an extreme example, in which the walls of a testis (green shading, w) are severely disrupted. (lu – lumen; mes – surrounding mesenchyme). (c,d) In specimens fixed with 54 mM cacodylate, cells of the gut are also closely apposed. (c) Contacting surfaces of goblet cells (go) with proteinaceous granules (pg) and phagocytes (phg) are uninterrupted. (d) In-folded and interlaced basal membranes of gut phagocytes, in contact with a basal lamina (bl); mus – muscle fibres; ld – lipid droplet. Note the lack of spaces between folds and projections of the phagocyte membranes. (e,f) Light micrographs of 0.5 μm cross-sections through the digestive tracts of independently processed sexual (e) and asexual worms (f), fixed in hypertonic (77.5 mM) cacodylate buffer. Separations between goblet cells and surrounding phagocytes are common (red arrows) and readily apparent even by light microscopy. Intracellular vacuoles are highly dilated (*). Lipid droplets stain a greenish colour and tend to be found toward the basal domains of gut phagocytes. (g) Transmission electron micrograph of a thin section adjacent to the boxed region shown in (f), showing a basal portion of the gut. Even in this region, which appears mildly affected at the light-microscopic level (f), there are clear separations and spaces (*) between processes and folds of the cells. Arrowheads indicate the basal lamina, for orientation. Scale bars – a: 5 μm; b: 20 μm; c: 1 μm; d, e: 2 μm; f, g: 50 μm; h: 2 μm.

