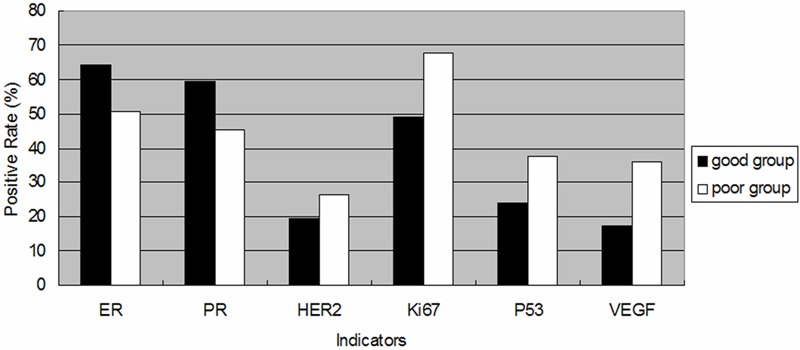
Figure 1.

Histograms of six parameters in two groups based on different prognosis. Black block: positive rate of ER, PR, HER2, Ki67, p53 and VEGF in patients with ‘good group’; white block: positive rate of n ER, PR, HER2, Ki67, p53 and VEGF in patients with ‘poor group’. There is statistically significant difference in five indicators expression within the groups (P < 0.05).
