
Figure 2.
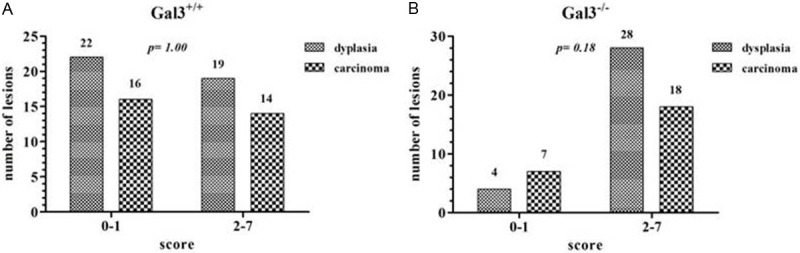
Intra-group analysis depicting the number of dysplastic and carcinomatous lesions expressing low (score: 0 to 1) and high (score: 2 to 7) APC protein in Gal3+/+ (A) and Gal3-/- (B) mice.
Official websites use .gov
A
.gov website belongs to an official
government organization in the United States.
Secure .gov websites use HTTPS
A lock (
) or https:// means you've safely
connected to the .gov website. Share sensitive
information only on official, secure websites.
Intra-group analysis depicting the number of dysplastic and carcinomatous lesions expressing low (score: 0 to 1) and high (score: 2 to 7) APC protein in Gal3+/+ (A) and Gal3-/- (B) mice.