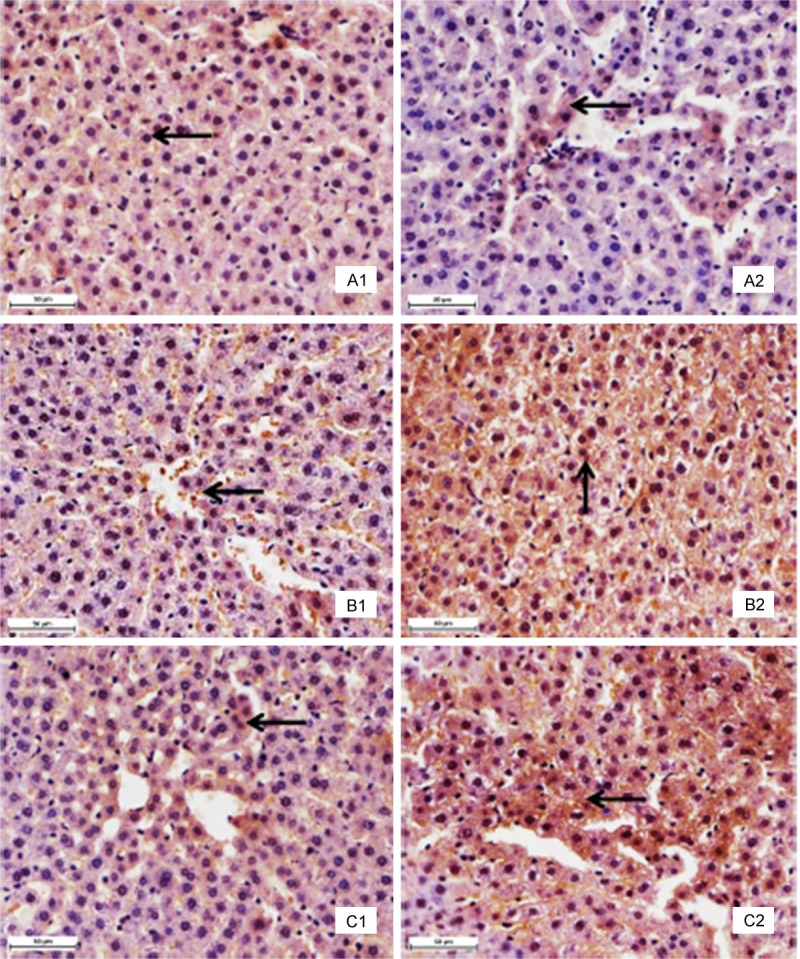
Figure 2.

Immunohistochemistry with specific antibody against Bcl-2, Bax and caspase-3 in liver tissues. Panel A: Bcl-2 protein. There are many positive cells (brown stain) in the control group (A1). The positive cells markedly decreased in the group IV (A2). Panel B: Bax protein. There are several positive cells (brown stain) in the control group (B1). The positive cells markedly increased in the group IV (B2). Panel C: Caspase-3 protein. There are a few positive cells (brown stain) in the control group (C1). The positive cells markedly increased in the group IV (C2). The arrows demonstrate positive immunoreation. Immunohistochemical labeling of HRP-streptavidin detection and HE counterstain, final magnification × 400, bars = 50 μm.
