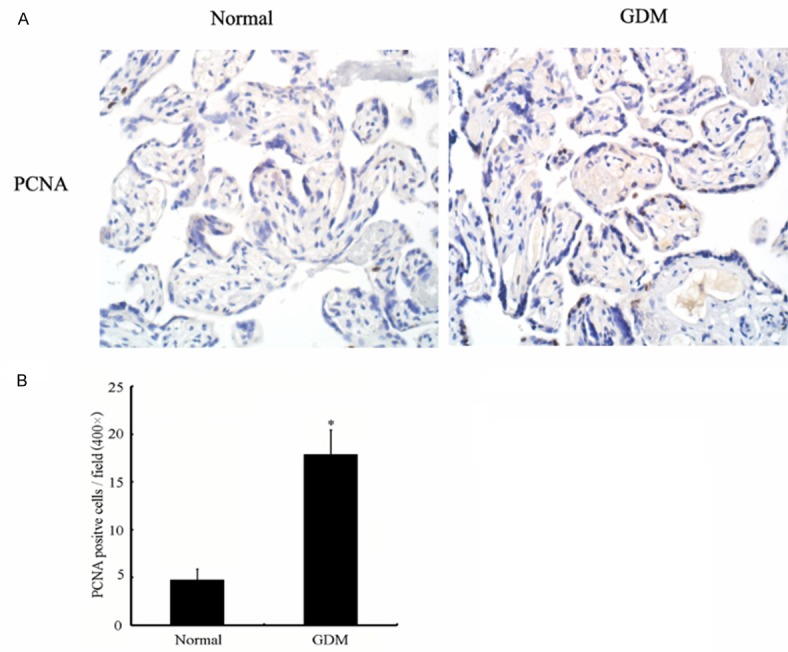
Figure 2.

Cell proliferation in human placenta trophoblast cells of different glucose tolerance states; normal and GDM. A. Histological sections were immunostained for PCNA expression (see text). The number of trophoblasts in 10 representative fields was counted. Cell proliferation was quantified by the percentage of trophoblasts stained positive for PCNA. B. There are a significantly higher percentage of PCNA positive cells in GDM than in normal group. Qualified statistical data are the mean ± SE of at least 3 separate experiments. *, P < 0.05.
