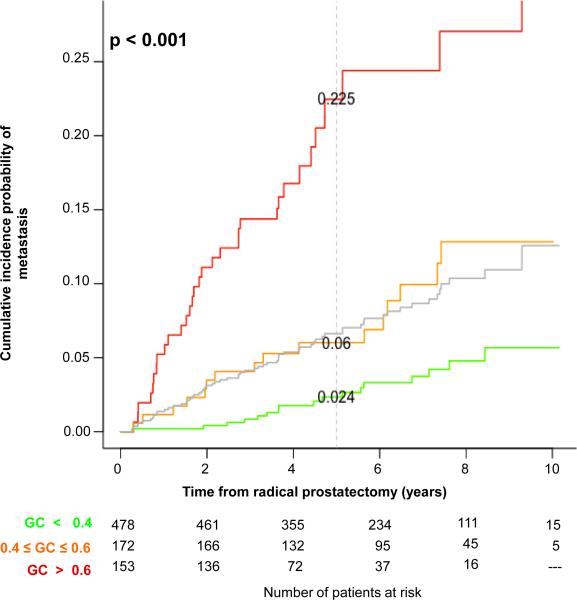
Figure 3. Cumulative incidence of clinical metastasis based on GC score risk groups.
The grey curve indicates the underlying cumulative incidence rate of metastasis in the full cohort obtained by resampling controls. Sixty percent of patients had low GC scores (<0.4, green) with incidence of metastasis lower (2.4% at 5 years) than the average risk of the cohort at any time point. Patients with high GC scores (>0.6, red) had a much higher cumulative incidence reaching 22.5% at 5 years. Total number of patients at risk was 803 at t=0 from weighting controls sampled from the original population after excluding those with unavailable tissue. The dashed grey line indicates the 5-year time point following radical prostatectomy.

