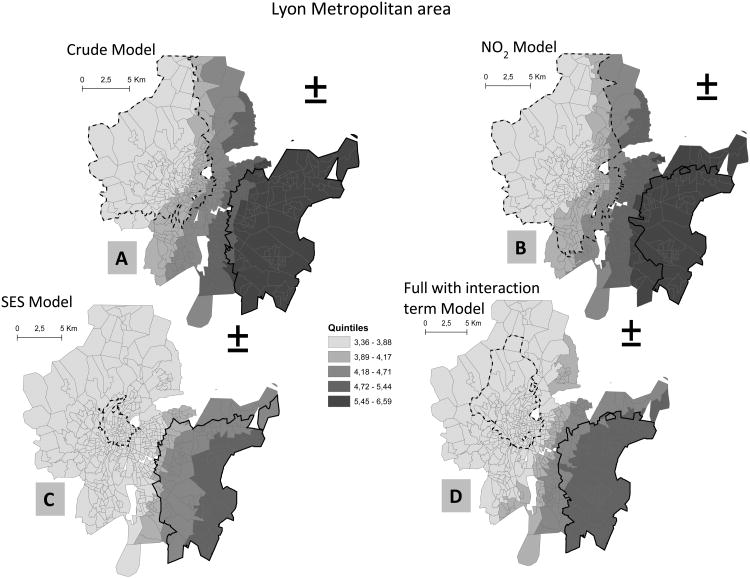
Figure 5.
(A) Prevalence of infant mortality estimated by the GAMs in the Lyon Metropolitan Area for crude model (A), according to (B) NO2 air pollution exposure, (C) deprivation index and (D). with the interaction term. Light grey to dark grey shading indicates lower to higher prevalence. Solid lines identify areas with significantly increased rates (hotspots) and dashed lines identify areas with significantly decreased rates (coldspots).

