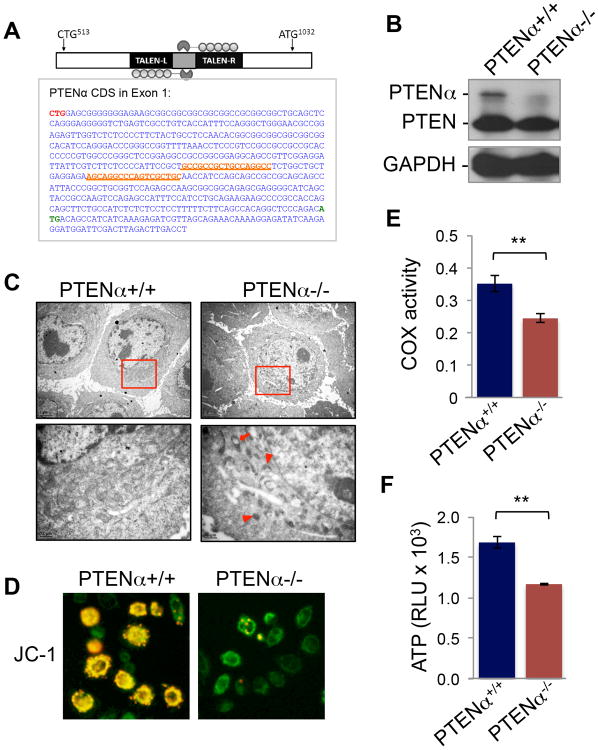
Figure 6. Somatic knockout of PTENα impairs mitochondrial structure and function.
(A) Somatic knockout of PTENα with the TALEN technique. Upper panel, schematic strategy of PTENα TALEN knockout. Lower panel, sequence of PTENα CDS in exon 1. TALEN targeted left and right arms are underlined and highlighted in orange. CTG513 and ATG1032 are highlighted in red and green respectively.
(B) Western blot confirming elimination of PTENα.
(C) Marked mitochondrial morphological alterations in PTENα-/- HeLa cells shown by electron microscopy. Arrowheads indicate smaller condensed mitochondria. The arrow points to a mitochondrion with expanded vesicles.
(D) JC-1 staining showing loss of red-J-aggregate fluorescence in PTENα-/- cells (right) as compared with PTENα+/+ cells (left).
(E) Impaired COX activity in PTENα-/- cells. Mitochondria were extracted from PTENα+/+ and PTENα-/- cells for analysis of COX activity.
(F) PTENα knockout reduces ATP production. Data are presented as mean±SD of three replicates and analyzed by paired t-test. **, p <0.01.

