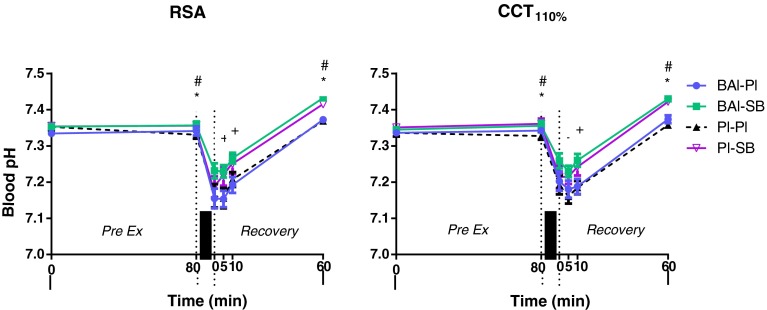
Fig. 4.
Blood pH recorded for the different groups during the repeated sprint ability (RSA) and cycling capacity test (CCT110 %). Values expressed as mean ± SEM. *p < 0.05 BAl-SB and Pl-SB from Pl–Pl, # p < 0.05 BAl-SB and Pl-SB from PreEx0, + p < 0.05 BAl-SB from Pl–Pl, thick vertical bar denotes exercise

