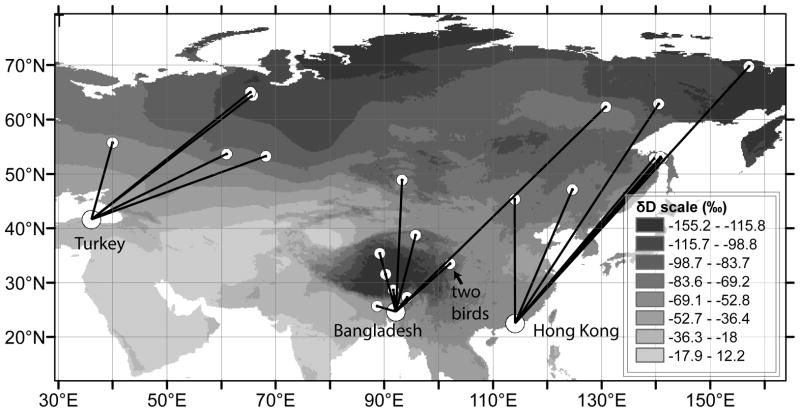
Fig 1.
Map of Asia and Eastern Europe showing satellite tag deployment and feather collection locations (large circles), apparent molt locations (small circles), and the distribution of δD in rainwater during August (shading) based on data from Bowen (2011). Tagging and feather collection took place in late winter 2010 for Bangladesh and Turkey and in December 2010 for Hong Kong. Tagging locations and apparent molt locations are connected with straight lines and do not represent actual migration paths.

