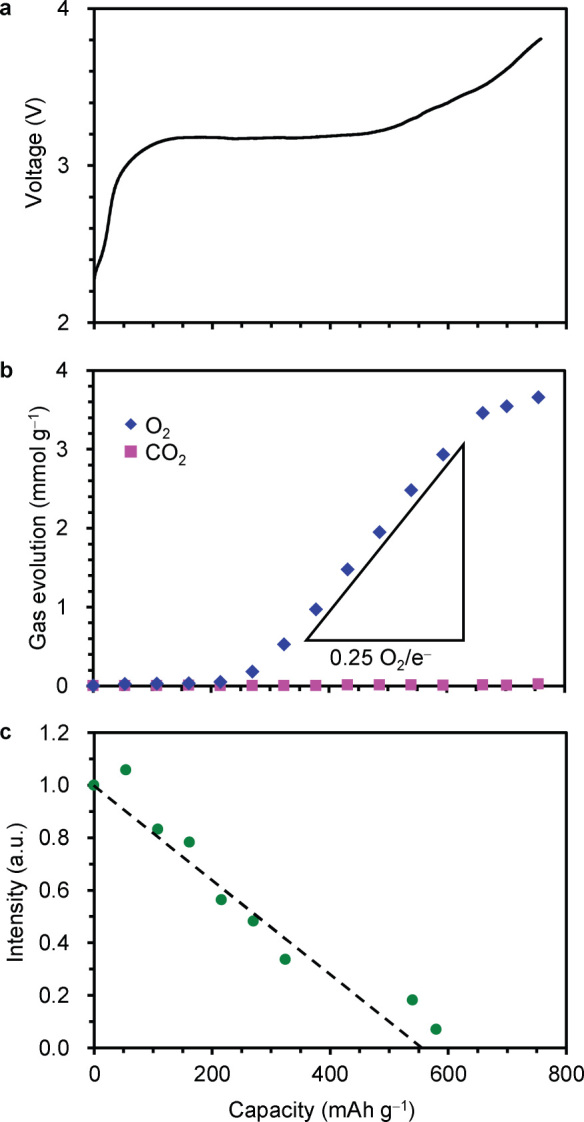
Figure 4. Voltage, gas evolution, XRD peak intensity of the Co-doped Li2O cathode in the charge process.

(a) The voltage curve. (b) Cumulative amounts of O2 and CO2 evolved in the charge process at the current density of 4.5 mA g−1. The slope of 0.25 O2/e− indicates theoretical rate of O2 evolution according to the reaction, 2O2− → 4e− + O2. (c) The XRD 111 peak intensity of Co-doped Li2O. The peak intensity at 0 mAh g−1 was taken as a unity. The black line is a theoretical line of change in the peak intensity.
