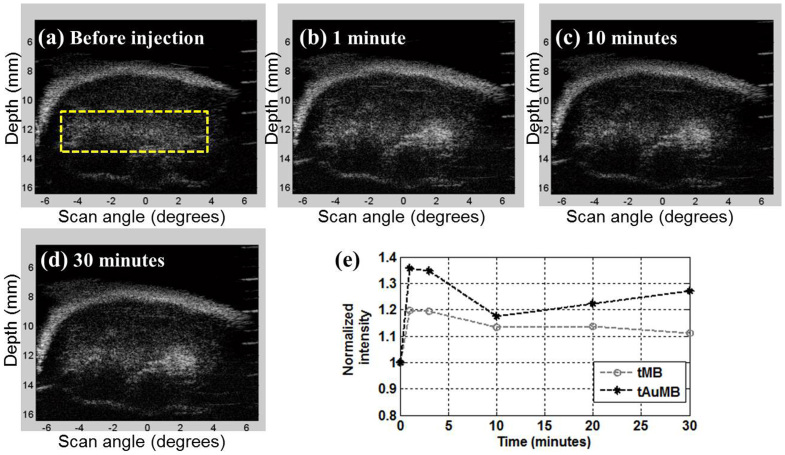
Figure 1. Ultrasound molecular images obtained when tAuMBs were injected into the mouse.
Tumor B-mode images were obtained (a) before the injection and at (b) 1 minute, (c) 10 minutes, and (d) 30 minutes after the injection. (e). Time–intensity curves calculated for the intensity within the region of interest (rectangular box in panel a) in the B-mode images for the tMB and tAuMB cases.

