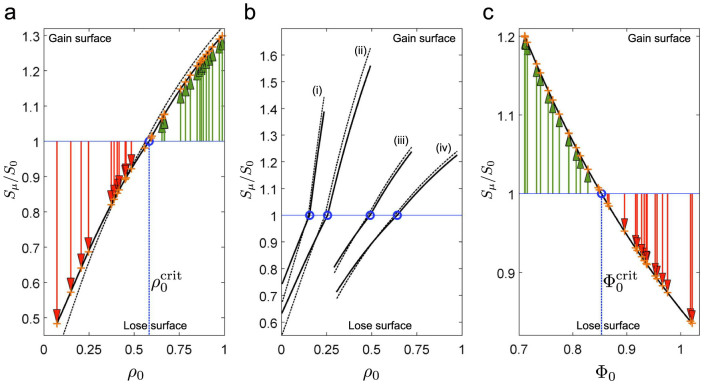
Figure 5. Lipid competition tipping points.
(a) Phospholipid competition between 30 model phospholipid-laden vesicles each with a different DOPA fraction randomly assigned over the uniform interval 0 < ρ0 < 1 and initially spherical, 120 nm diameter. Depending on initial DOPA fraction, each vesicle starts at a point on the horizontal blue line, and grows (green arrows) or shrinks (red arrows) to a point on the black line. The form of the black line is specific to this particular competing population, and is computed by equation (15). Competition ‘tipping point’ is shown by blue circle: any vesicle with  gains lipids from its competitors. The solid black line shows relative growths when only the indirect effect exists (d = 0); for comparison, the dashed black line shows relative growths when the direct effect also maximally present (d = 1). Initial fatty acid concentration inside and outside model vesicles was [L] = 5.0 × 10⁻⁵ M. (b) Phospholipid competition in four unique populations of 30 model vesicles, with DOPA fraction randomly assigned over uniform intervals (i) 0 < ρ0 < 0.25, (ii) 0 < ρ0 < 0.5, (iii) 0.25 < ρ0 < 0.75 and (iv) 0.3 < ρ0 < 1.0, demonstrating the context-dependence of competition. (c) Osmotic competition between 30 model oleate vesicles, each with 120 nm surface diameter and each starting with a different degree of swelling, from maximally swelled to 5% deflated (Φ0 randomly assigned over uniform interval 0.7 < Φ0 < 1.0348). Any vesicle starting at tension state
  gains lipids from its competitors. Initial fatty acid concentration inside and outside vesicles was [L] = 6.67 × 10⁻⁵ M. Environment volume for competition in all three plots was 1.04 × 10⁻¹⁴ litres. Orange crosses show agreement with equilibrated deterministic simulation of the model.

