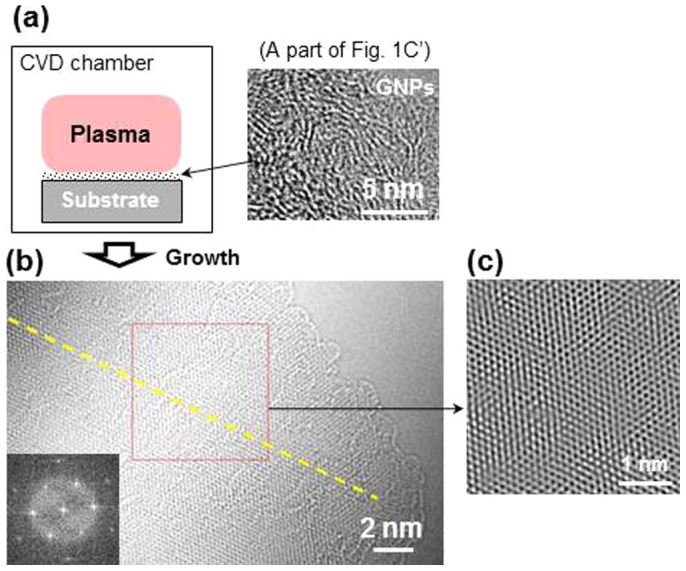
Figure 3. Schematic explaining the seeded growth of graphene and HRTEM images.

(a), Schematic explaining the seeded growth of graphene under a plasma condition. (b), Titan HRTEM (operating at 80 kV) image of a graphene sheet. The yellow line passing through the atomic lattices is a visual indication of the single crystal graphene sample. We attribute local mosaic lattices to overlaps of smaller graphene fragments. The inset is FFT diffraction pattern of the region indicated in (b). (c), Inverse FFT image taken from the region indicated in (b).
