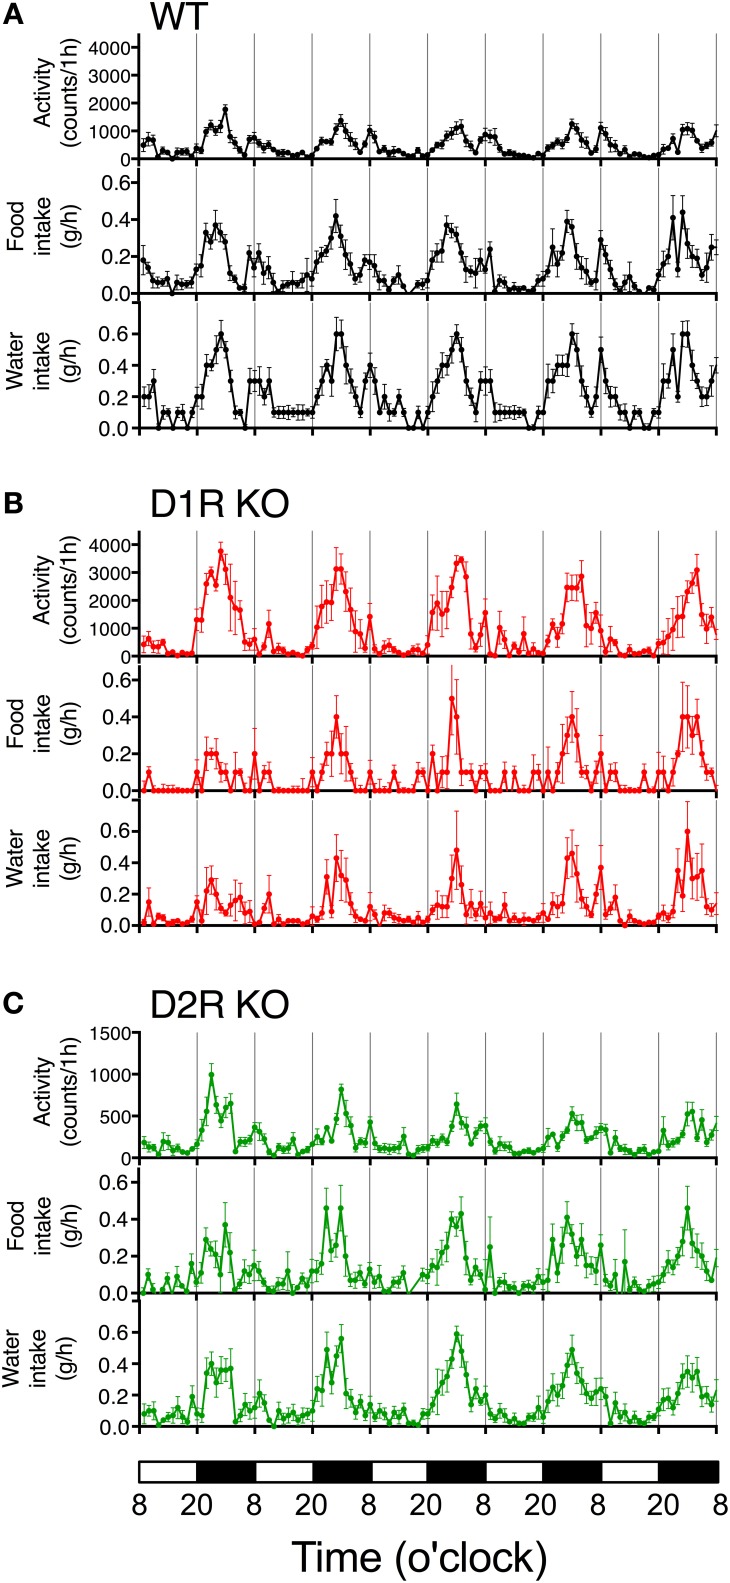
Figure 3.
Time courses of motor activity, intake, and water intake. The activity counts and food and water intake profiles of (A) WT, (B) D1R KO, and (C) D2R KO mice are plotted against time (1 h time bins). The lower white and black bars represent the 12 h light and dark phase. The plotted values are mean ± s.e.m.

