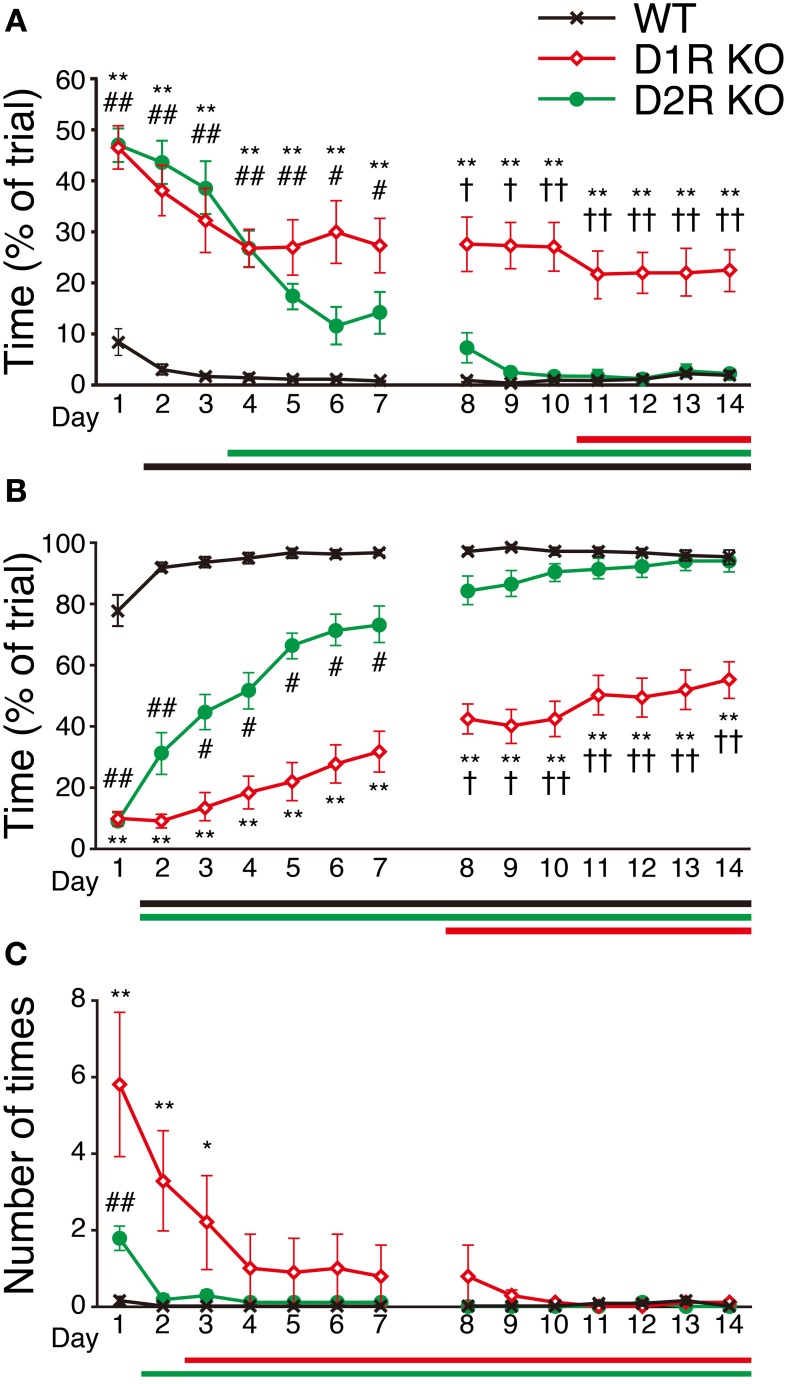
Figure 6.
Performance in Step-Wheel task. (A) Touch Time (% of trial), (B) Water On Time (% of trial), and (C) number of Turn Stops are represented as group means ± s.e.m. Significantly differences in performance between genotypes were found on days marked by *p < 0.05, **p < 0.01 for D1R KO vs. WT mice; #p < 0.05, ##p < 0.01 for D2R KO vs. WT mice; †p < 0.05, ††p < 0.01 for D1R KO vs. D2R KO mice (Kruskal–Wallis test). Significant improvement of performances compared with that on the 1st day was found on days marked by horizontal bars shown under the graphs (p < 0.05, Dunnett test; WT, black; D1R KO, red; D2R KO, green).

