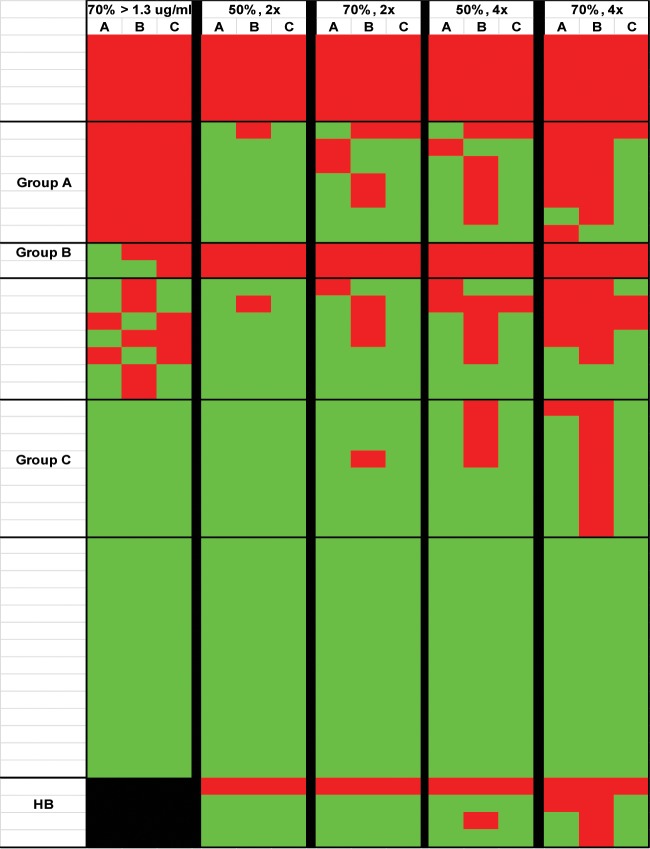
FIG 3.
Comparison of classifications using threshold or fold-change methods. Patients labeled as responders according to each set of criteria are represented in green, while nonresponders are represented in red. Each row represents the clinical classification for an individual patient, while each column shows results from a single laboratory. HB, high-baseline samples (which were not classified using the threshold approach). Groups A, B, and C represent different response patterns as described in the text. Column headers represent the cutoff values used to define responses by either the threshold (70% of serotypes reaching a level of >1.3 μg/ml) or fold-change (percentage of serotype, fold change) approach.

