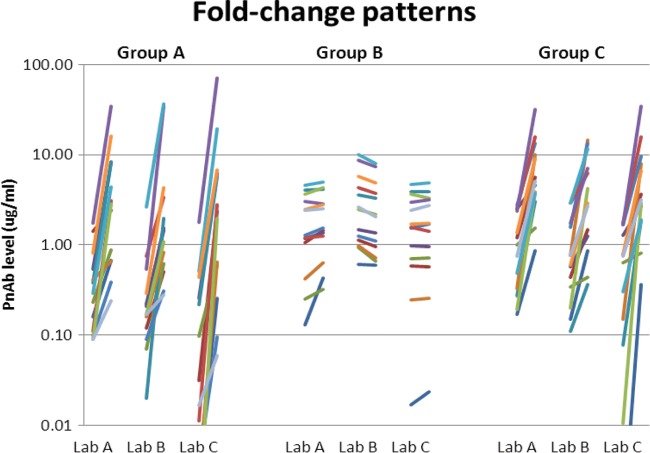
FIG 4.
Response patterns in samples from patients with discordant results. Group designations refer to different patterns of response as shown in the heat map in Fig. 3. A representative patient for each response pattern is shown. Each line represents the change between pre- and postvaccination levels for an individual serotype. Group A, responder by fold increase, nonresponder by threshold. These patients showed increases in most serotypes in all the laboratories but their levels failed to reach the 1.3-μg/ml threshold in 9 serotypes. Group B, nonresponders by fold increase, mixed results by threshold. This group tended to have high prevaccination levels and showed little response postvaccination. Group C, nonresponders at 4-fold for lab B but responders under all other criteria and assays. The levels in these patients showed increases for most serotypes in all labs, but samples had a slightly lower response in lab B assays relative to those in the other laboratories.

