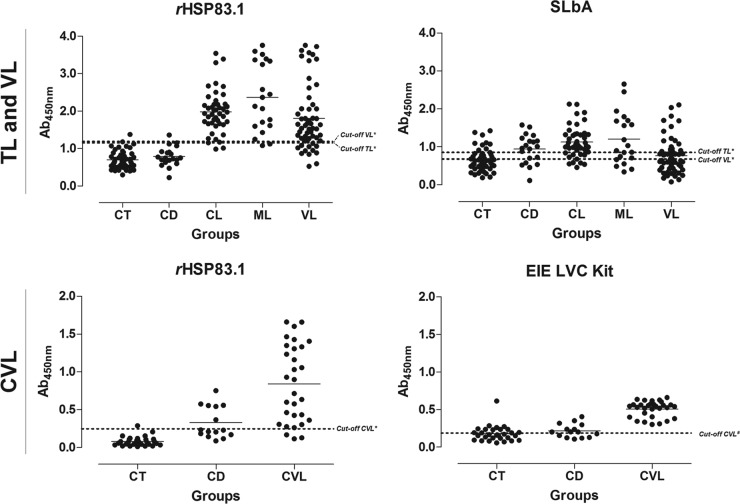
FIG 3.
Comparison of the reactivity of ELISAs against rHSP83.1 and SLbA and the EIE-LVC kit against serum samples from TL and VL patients and from L. infantum-infected dogs. (Top) ELISAs were performed on samples from different groups of individuals (CT [control] group, n = 50; CD [Chagas disease] patients, n = 20; CL [cutaneous leishmaniasis], n = 45; ML [mucosal leishmaniasis], n = 20; VL [visceral leishmaniasis], n = 55). (Bottom) ELISAs were performed on samples from different groups of dogs (CT [control group], n = 30; CD [T. cruzi-infected dogs], n = 15; CVL [canine visceral leishmaniasis], n = 30). An asterisk indicates a cutoff value obtained by ROC curve; a pound sign indicates a cutoff value obtained according to the manufacturer. Dots represent individual absorbance values. The dotted line represents the cutoff value. The solid line corresponds to the mean values. Ab450nm, absorbance at 450 nm.

