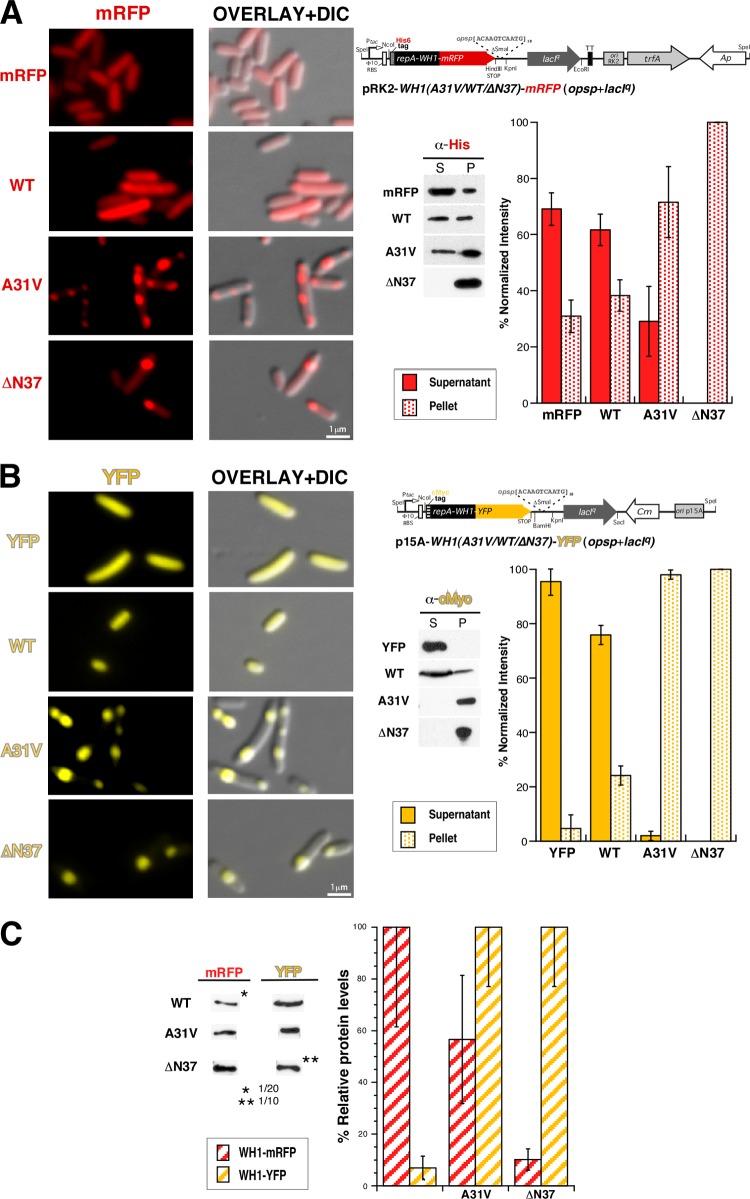
FIG 1.
Expression in E. coli of single RepA-WH1 variants (WT, A31V, or ΔN37) fused to red (mCherry/mRFP) (A) or yellow (YFP) (B) fluorescent protein tags. Left panels show microscopy imaging (fluorescence and DIC) of representative cells, and right panels show linear schemes (not drawn to scale) of the plasmid vectors used for protein expression (Table 1). Gel insets correspond to Western blots of sedimentation analyses of whole-cell lysates from the same cultures, which were then quantitated (histograms). (C) A Western blot quantitation of the relative expression levels achieved for the distinct RepA-WH1 constructs when cloned in pRK2 (mRFP) or p15A (YFP). Samples were whole lysates from equivalent cell numbers. In all panels, histograms represent the mean intensities of the distinct protein bands, calculated from three independent experiments. Dilution factors were applied for gel loading of those samples in which high overexpression levels were achieved (asterisks) to allow for unsaturated detection. Dilutions were then taken into account for quantitation. Standard deviations are displayed on each histogram bar. RBS, ribosome binding site; α, anti.

