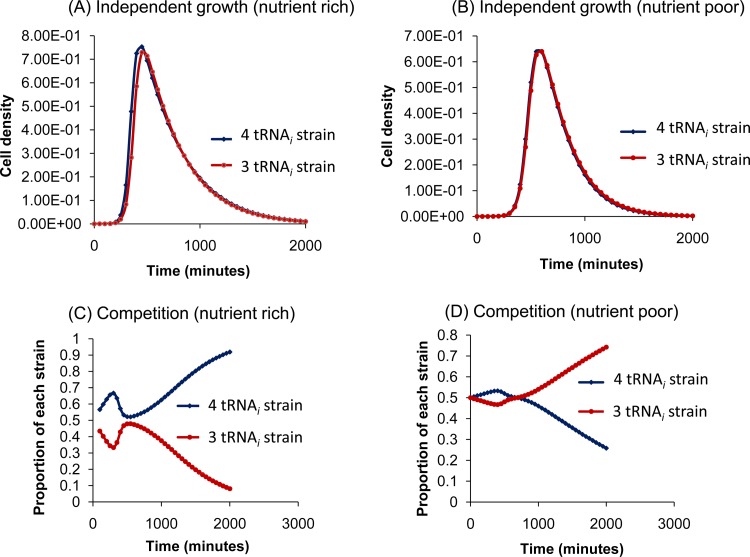
FIG 4.
Simulated growth experiments. Outcomes of simulated competitions between pairs of E. coli strains containing 4 or 3 tRNAi genes in nutrient-rich (A and C) and nutrient-poor (B and D) environments. (A and B) Growth curves when the two strains are grown independently. (C and D) Relative proportions when the strains share an environment. The actual cell densities in panels C and D are lower than those in panels A and B, respectively (see the supplemental material). The 4- and 3-tRNAi-gene strains have almost identical growth profiles by themselves but behave very differently when forced to compete. At the start of a simulation, cell density was 105 cells/ml, the nutrient density was 25 (arbitrary units), and the waste density was zero. The graphs represent the proportions of the two competing strains as a function of time in minutes. Except for tRNAi gene copy numbers, the competing strains were assumed to possess identical physiological parameters (see equations 1 to 3 in Materials and Methods). For panel A, the following values were used: minimum cell doubling time during exponential growth (T2), 20 min; maximum value of (linear) benefit to growth rate per tRNAi gene copy (α), 0.858; (quadratic) cost to growth rate per tRNAi gene copy (β), 0.101; autonomous cell death rate (i.e., with no waste) (δ), 0.0017 min−1; substrate level at which the efficiency of substrate utilization drops by half (S0), 0.5; rate of waste production per unit of cell density (λ), 0.05; rate of waste decay (λ0) = 0; reciprocal of the waste density at which the death rate doubles (μ), 1.0 and λ0 = 0 (see equation 2). Except for S0, which has been raised from 0.5 to 4.5, the simulation outputs shown in panel B are based on the same parameter values.

