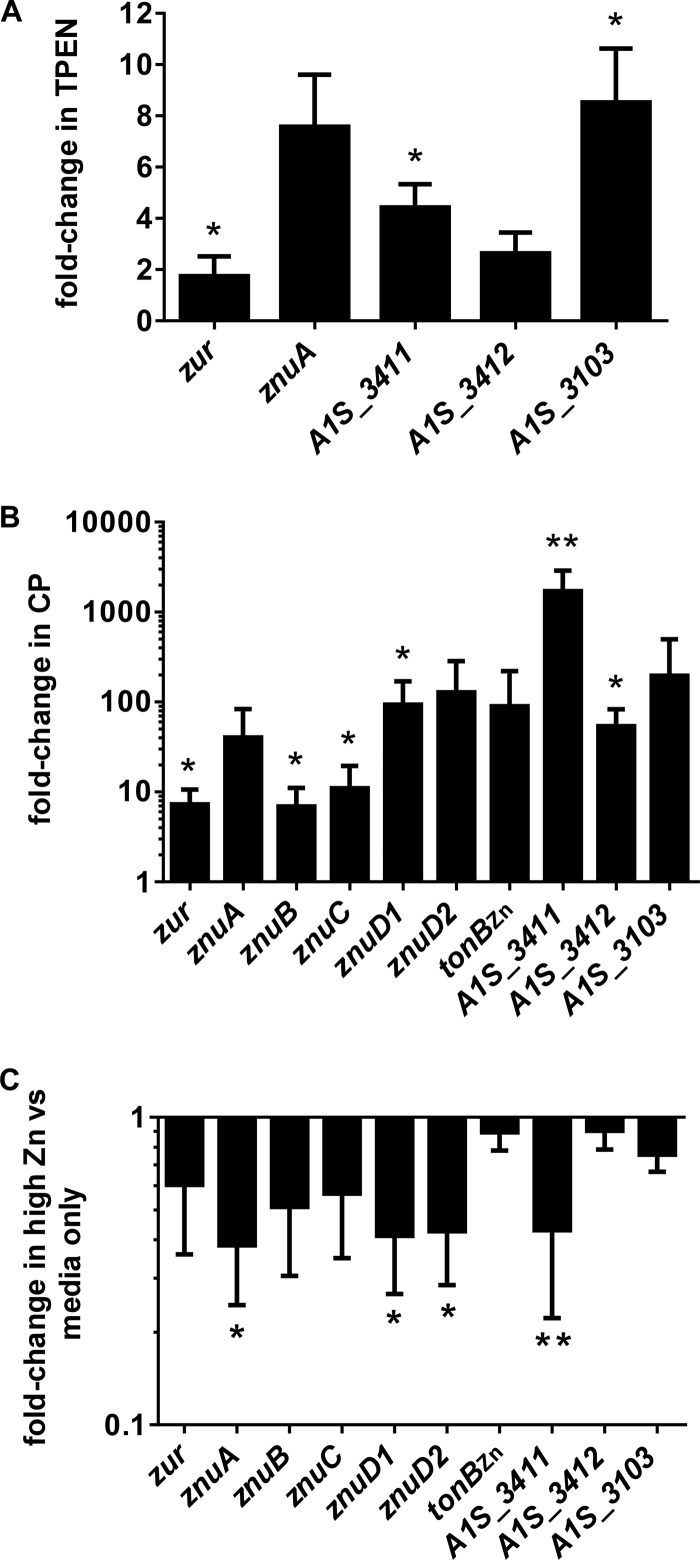
FIG 2.
Expression of putative Zur-regulated gene changes in response to various Zn levels. (A) Expression of selected genes in bacteria grown in the presence of 25 μM Zn chelator TPEN. (B) Expression of selected genes in bacteria grown in the presence of 250 μg/ml vertebrate protein CP. (C) Expression of selected genes in Zn-replete conditions (100 μM ZnCl2). Gene expression was determined by qRT-PCR. The graph depicts fold changes under treated conditions relative to untreated conditions (LB only). Data represent at least three separate experiments. Statistical significance was determined by Student's t test using a reference value of 1.0. *, P ≤ 0.05; **, P ≤ 0.005.

