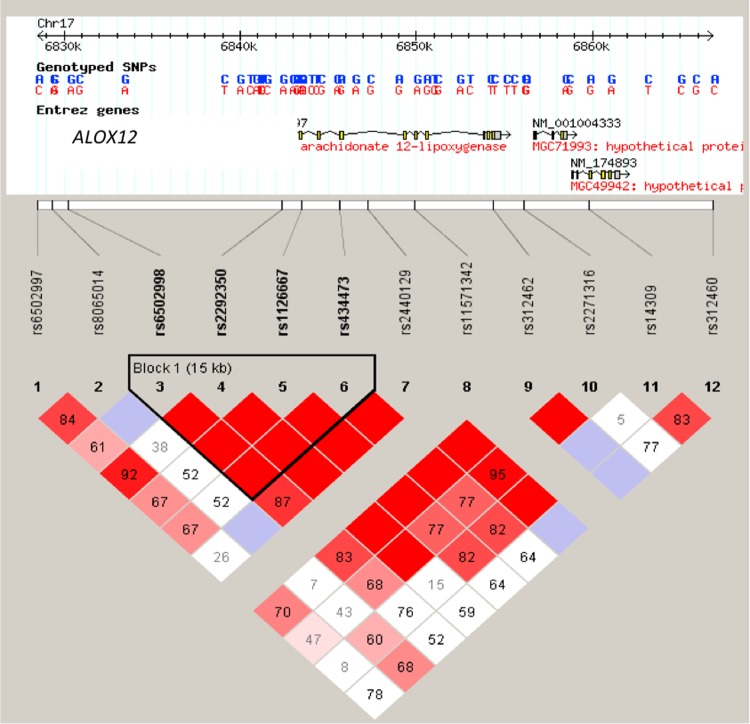
FIG 1.
Analysis of ALOX12 SNPs. (Upper diagram) Positions of genotyped SNPs within the gene. (Lower diagram) LD plots generated in Haploview using ALOX12 gene data from the NCCCTS cohort. The LD (D′ × 100) between any 2 markers is indicated at the intercept of the markers on the matrix. Where no value is given, linkage disequilibrium (D′) is 1 (LD is 100). Red diamonds indicate the greatest linkage disequilibrium and white diamonds the least. Black lines outline SNPs in haplotype blocks, and SNPs in perfect linkage disequilibrium with each other are represented by red blocks.

