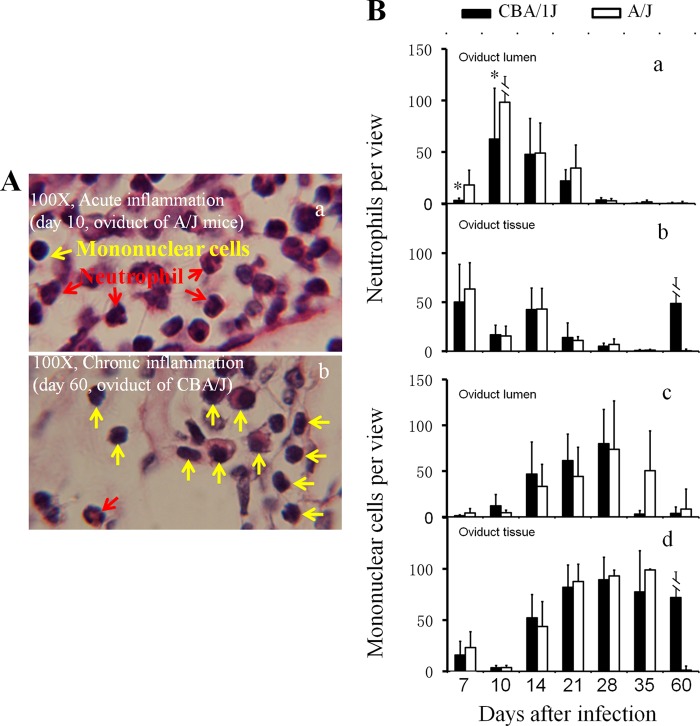
FIG 5.
Detecting oviduct inflammatory cells following C. muridarum infection. The H&E-stained sections described in the legend to Fig. 4 were reexamined for identifying neutrophils and mononuclear cells. (A) Example images marked with either neutrophils (red arrows) or mononuclear cells (yellow arrows) are shown. In the image taken from an oviduct tissue section with an acute infection, more neutrophils were detected (a, A/J mice), while at the chronic stage, more mononuclear inflammatory cells, including plasma cells, lymphocytes, and macrophages, were detected (b, CBA/J mice). Total inflammatory cells and neutrophil and mononuclear cell subpopulations were counted in individual 100× objective lens views (for high-density infiltration) or the entire oviduct tissue or lumen section (for scarce infiltration). (B) The number of neutrophils (a and b) and mononuclear cells (c and d) per view from either oviduct lumen (a and c) or tissue (b and d) areas of each mouse was used to calculate means and standard deviations for each group as shown along the y axis. Note that both CBA/J (solid bar) and A/J (open bar) mice were dominated by neutrophils in both oviduct lumen and tissues during the first 10 days of infection (a and b), followed by mononuclear cells (c and d). Interestingly, levels of oviduct lumenal neutrophils were significantly higher in A/J than CBA/J mice on days 7 and 10.

