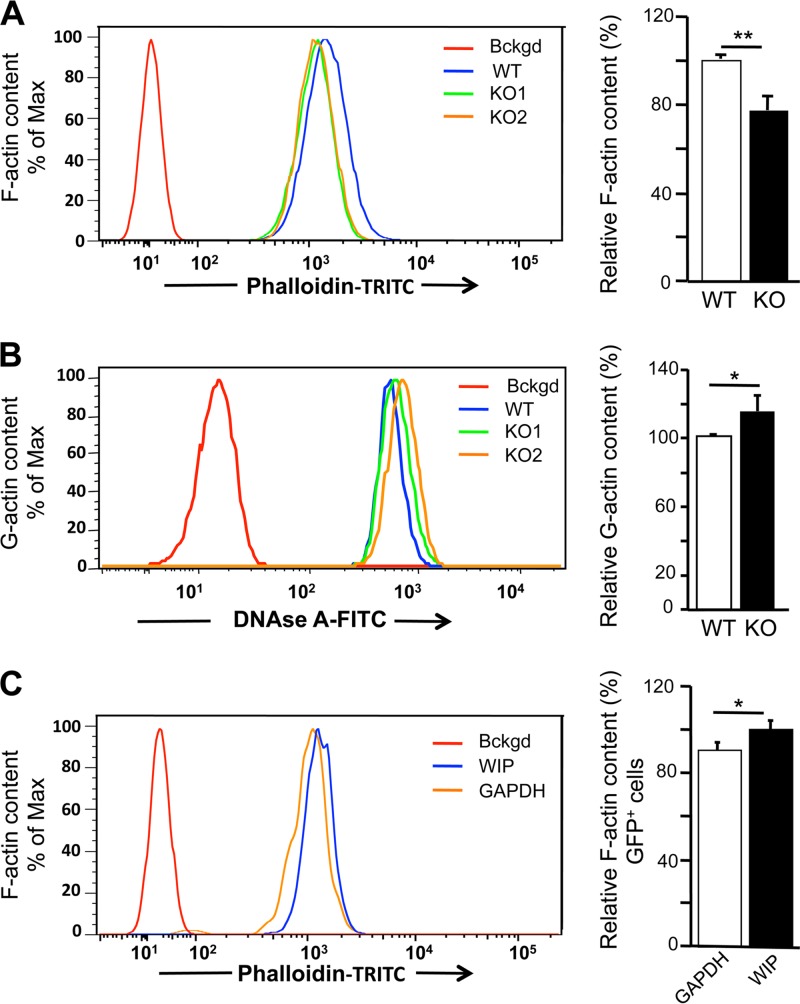
FIG 4.
Altered F-actin and G-actin contents in WIP−/− fibroblasts. (A and B) Representative FACS and quantitative analyses of F-actin (A) and G-actin (B) in WIP−/− and WT fibroblasts. Unstained cells were used as a background (Bckgd) control. Quantitative results are expressed relative to the means for WT fibroblasts. (C) Representative FACS and quantitative analyses of the effect of transduction with bicistronic vectors encoding WIP and tGFP, or GAPDH and tGFP as a control, on F-actin contents in WIP−/− fibroblasts. Analysis was performed on cells gated for tGFP (green) expression. Quantitative results are expressed relative to the means for fibroblasts transduced with the vector encoding GAPDH and tGFP. Results in panels A and B represent three independent experiments performed on two WIP−/− lines and two WT lines. Results in panel C represent two independent experiments, each performed on two WIP−/− lines. Bars represent means; error bars, standard deviations. *, P < 0.05; **, P < 0.01.

