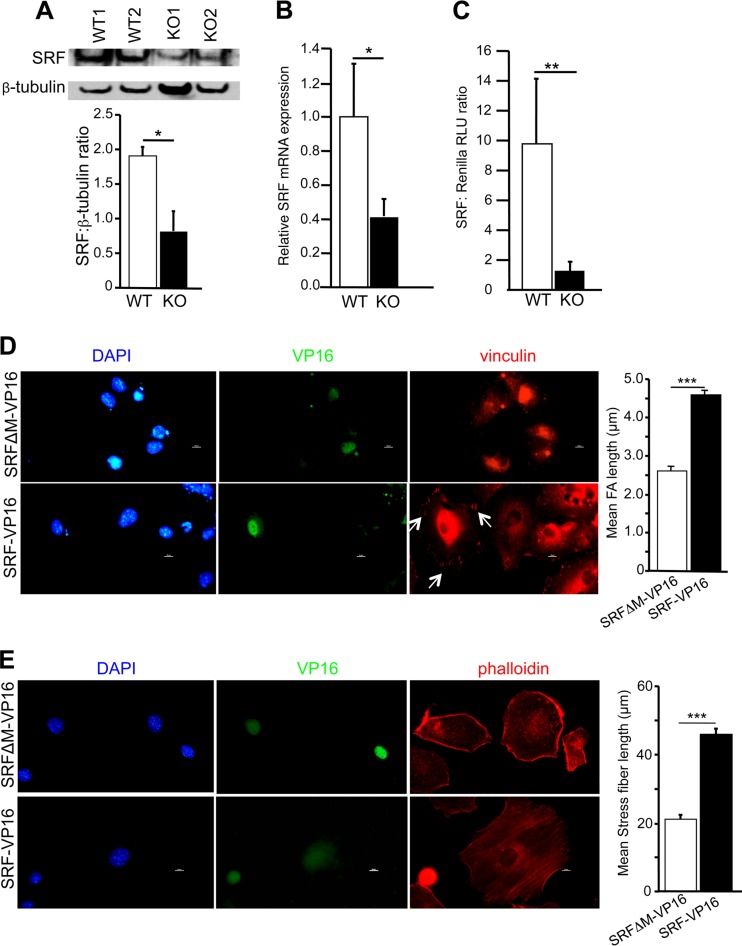
FIG 5.
Decreased SRF expression and activity in WIP−/− fibroblasts. (A and B) Representative immunoblot analysis and quantitation of SRF (A), and quantitative PCR analysis of Srf mRNA expression (B), in WIP−/− and WT fibroblasts. (C) Reporter gene assay of SRF activity in WIP−/− and WT fibroblasts cultured in 10% FCS. RLU, relative light units. (D) (Left) Representative immunofluorescence images of WIP−/− fibroblasts transfected with SRF-VP16 or with SRFΔM-VP16 as a control and stained for vinculin (red) and VP16 (green) and with DAPI (blue). (Right) Quantitative analysis of FA length in VP16-expressing cells. (E) (Left) Representative immunofluorescence images of WIP−/− fibroblasts transfected with SRF-VP16 or with SRFΔM-VP16 as a control and stained for phalloidin (red) and VP16 (green) and with DAPI (blue). (Right) Quantitative analysis of stress fiber length in VP16-expressing cells. Results in panels A to C represent three independent experiments, each performed on two WIP−/− and two WT lines. Results in panels D and E represent two independent experiments, each performed on two WIP−/− lines. Bars represent means; error bars, standard deviations. *, P < 0.05; **, P < 0.01; ***, P < 0.001.

