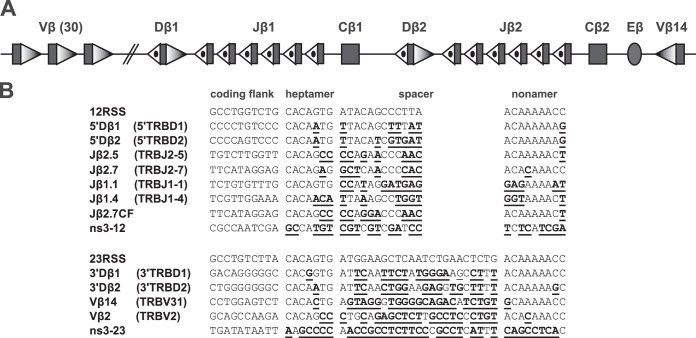
FIG 1.
Tcrb locus. (A) The general structure of the Tcrb locus is depicted schematically and not to scale; rectangles represent gene segments, an oval represents the Eβ enhancer, shaded triangles represent 23-RSSs, and dotted triangles represent 12-RSSs. (B) Alignment of coding flank, heptamer, spacer, and nonamer sequences of the RSSs discussed in the text. For each RSS, any differences from consensus are underlined. Table 1 gives the full sequence of each oligonucleotide used. GenBank gene segment names (http://www.ncbi.nlm.nih.gov/gene/21577) are shown in parentheses for endogenous RSSs.

