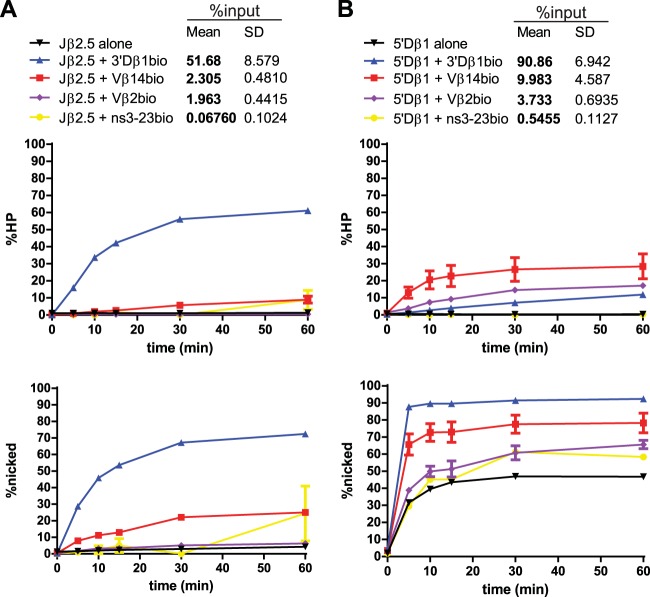
FIG 3.
Jβ2.5 and 5′Dβ1 nicking is stimulated by partner substrates. (A) Quantitation of time course experiments on Jβ2.5. All reactions were repeated three times. The top graph shows percent hairpinning (HP) over time, while the bottom shows percent nicking over time. The table at the top of the panel provides the legend for the graphs and includes the mean and standard deviation (SD) of the percentage of input radioactivity recovered for the indicated RSS pair. In these and all similar plots, each data point represents the mean of three independent values and is plotted with an error bar that represents the standard error of the mean (SEM). In many cases, the error bar is so small that it is not easily visible. (B) Quantitation of time course experiments on 5′Dβ1.

