FIG 3.
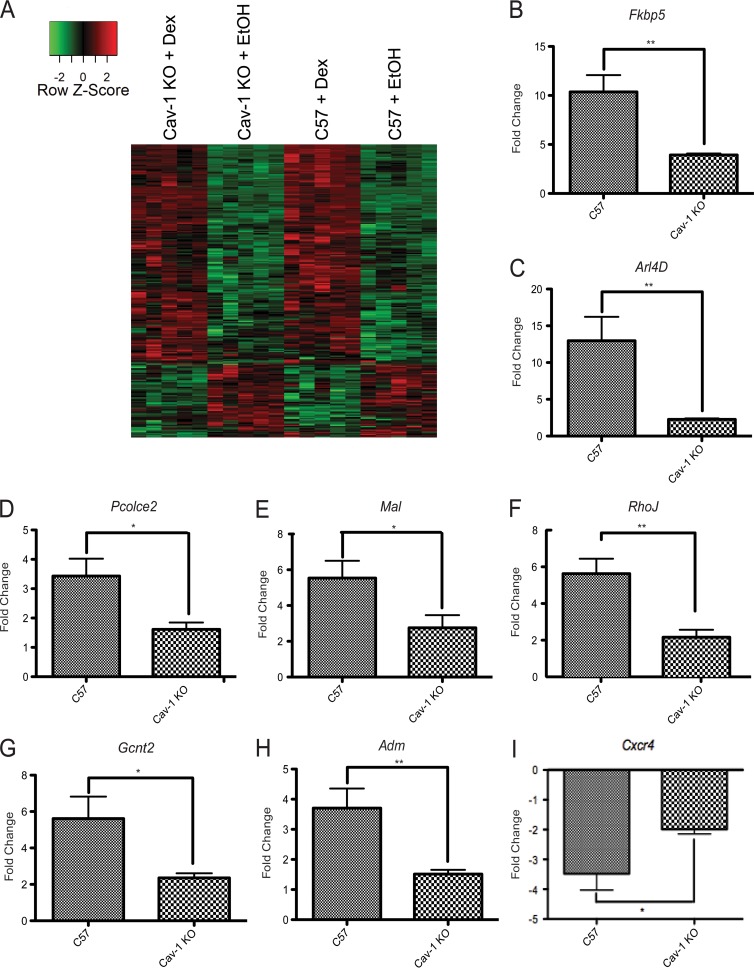
A subset of genes are differentially regulated by GR in C57 versus Cav-1 KO NPSCs. (A) Hierarchical gene clustering of 20 NPSC cultures using Dex-responsive genes in C57 and Cav-1 KO NPSCs (Student t test; false discovery rate < 0.1) using Pearson dissimilarity as the distance measure and the average linkage method for linkage analysis. The data are represented using a z-score normalized before plotting the heat map. For each gene (row), the z-score was calculated by subtracting the expression value by mean expression across all samples (centering) and dividing by the standard deviation (scaling). (B-I) C57 or Cav-1 KO NPSCs from tissues independent of those used for microarray analysis were treated for 4 h with 100 nM Dex and mRNA expression of indicated genes analyzed using qRT-PCR. Although all genes shown are significantly induced in response to Dex, activation is attenuated in the Cav-1 KO cells. Error bars represent the SEM (n = 6). *, P < 0.05; **, P < 0.01 (Student's t test).

